Abstract
Central nervous system (CNS) tumors are the deadliest cancers in children, highlighting the need for new therapies. The tumor-associated antigens (TAAs) WT1, PRAME and survivin are widely expressed by these tumors, and a manufacturing technique has been developed to target these intracellular TAAs using autologous, nongenetically engineered T cells. Here we therefore conducted ReMIND, an open-label, phase 1 adaptive dose-finding study to determine the safety/feasibility of autologous, systemically administered trivalent T cells targeting WT1, PRAME and survivin in children with CNS tumors. Eligible patients had newly diagnosed diffuse intrinsic pontine glioma without lymphodepletion (arm A, n = 16 enrolled, n = 11 infused) and relapsed/recurrent nonbrainstem CNS malignancies without (arm B, n = 28 enrolled, n = 18 infused) or with (arm C, n = 7 enrolled, n = 4 infused) lymphodepletion. Primary end points were safety, feasibility and maximum tolerated dose determination; secondary end points included preliminary efficacy and immunobiological correlates, including in vivo TAA-T persistence and systemic immune activation. Dose level 3 (8 × 10⁷ cells per m2 per dose) was determined as the maximum tolerated dose. Treatment was well tolerated with fatigue and headache being the most common adverse events, although two possibly related serious adverse events of tumor swelling occurred. One grade 5 event in a patient with diffuse intrinsic pontine glioma with hydrocephalus, tumor edema and respiratory failure was categorized as a dose-limiting toxicity. Median overall survival for arm A was 13.7 months from diagnosis (range, 6.2–32.0) and median progression-free survival for arms B/C was 5.0 months from infusion (range, 0.5–51.6). Three patients in arms B/C are alive without disease at 31.8, 41.2 and 51.6 months without further treatment, including one complete response. This trial met safety/feasibility primary end points with some preliminary signals of efficacy. ClinicalTrials.gov registration: NCT03652545.
Main
Central nervous system (CNS) tumors are the most common, and deadliest, cancers in children1. Diffuse intrinsic pontine glioma (DIPG) is an aggressive tumor that arises in the brainstem and comprises 10–20% of pediatric brain tumors2 with a poor prognosis and a median overall survival (OS) of 11 months3,4. Recurrent CNS cancers are likewise typically incurable with significant treatment-related morbidity5 highlighting the need for new therapeutic approaches.
T cell therapies have shown potential against viral infections and hematological malignancies6, but are thus far less effective in solid tumors, although some encouraging results have been recently published7,8. The polyclonal nature of multi-antigen-specific T cells9 may help overcome some potential obstacles, such as intratumoral heterogeneity. Our group has previously shown that tumor-associated antigen T (TAA-T) cells can safely induce prolonged disease stabilization in nonCNS pediatric solid tumors10, and peripherally infused chimeric antigen receptor (CAR)-T cells have been shown to cross the blood–brain barrier in high-grade glioma (HGG)11,12. Further, WT1, PRAME and survivin are widely expressed across pediatric brain tumors13,14,15,16,17. We therefore evaluated, in a phase 1 dose-escalation trial (NCT03652545), the safety and feasibility of intravenous infusion of multi-antigen-specific T cells targeting these tumor-associated antigens (TAAs) in children with newly diagnosed DIPG or recurrent brain tumors. The study met its primary end points, and as secondary end points, clinical responses were observed, including a durable complete remission.
Results
Study design, end points and patient characteristics
Pediatric and young adult patients with CNS malignancies were enrolled in a phase 1 adaptive dose-finding study entitled ‘Research on Multi-antigen T cell Infusion Against Neuro-oncologic Disease (ReMIND)’ from 18 September 2018 to 18 July 2024. The primary end points of the ReMIND trial were the safety and feasibility of intravenously administered TAA‑T therapy and determination of the maximum tolerated dose (MTD). Pre‑specified secondary end points included preliminary clinical efficacy, assessed by objective tumor response, progression-free survival (PFS) and OS, as well as in vivo persistence of infused TAA‑T cells and systemic immune activation (circulating cytokine and lymphocyte profiles); correlation of clinical outcomes with immune parameters; evaluation of droplet digital PCR for detection of peripheral markers of disease; and characterization of manufactured TAA‑T products (assessment of antigen specificity, in vitro activity and comparison with tumor antigen expression in patient samples). Immune correlative analyses were intended to be exploratory. Some of these correlates, particularly lymphocyte phenotyping, PCR‑based peripheral disease monitoring, and comparative analyses of TAA‑T product specificity relative to tumor antigen expression, are not reported in this paper.
Key eligibility requirements included age 6 months to 80 years, newly diagnosed radiographic DIPG (arm A) or relapsed/refractory/recurrent nonbrainstem high-grade CNS malignancy (arms B/C). Patients were required to have completed standard upfront therapy, to have adequate functional status (performance score ≥60) and baseline organ function, and to have met protocol-defined washout periods with anticipated steroid use of <0.4 mg kg−1 day−1 at the time of T cell infusion. In October 2022, a protocol amendment further required patients enrolled on arm A to receive their first TAA-T infusion within 5 months of initiating standard radiotherapy given the risk of early disease progression. Patients enrolled on arms B/C could not have evidence of uncal herniation or significant midline shift, nor a substantial brainstem disease component.
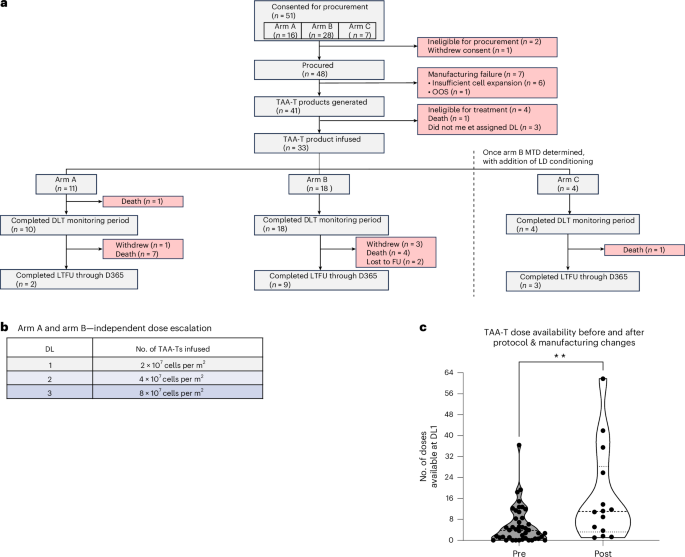
A total of 33 patients were infused intravenously with an autologous T cell product at three dose levels (DLs): 2 × 10⁷ cells per m2 per dose (DL1), 4 × 10⁷ cells per m2 per dose (DL2) and 8 × 10⁷ cells per m2 per dose (DL3) (Fig. 1a,b). Blood for TAA-T cell manufacture was collected via venipuncture. Arms A and B were dose-finding and did not include pre-infusion lymphodepleting conditioning, whereas arm C was added as an expansion at the confirmed arm B MTD and included fludarabine/cyclophosphamide lymphodepletion before the first infusion. TAA-T cells were manufactured by culturing antigen-presenting cells (APCs) with peptide libraries spanning the tumor-associated proteins WT1, PRAME and survivin; autologous T cells were then co-cultured with the peptide-loaded APCs, and the final TAA-T products were assessed for phenotype by flow cytometry and specificity by interferon (IFN)γ ELISpot.
Overall, 16 patients with DIPG were enrolled on arm A, and 11 of these patients were infused a median of 3.5 months (range, 1.1–4.3) after radiotherapy and 5.6 months (range, 3.0–9.3) from diagnosis (Fig. 1a and Table 1). Seven infused participants did not undergo biopsy, including one radiation-induced DIPG. Among the four participants who underwent biopsy (P11, P13, P27 and P38), molecular profiling indicated H3K27M mutations in H3F3A in all, TP53 mutation in three (P13, P27 and P38) and a single occurrence of PTPRZ1-MET fusion (P11). Five patients were not infused due to insufficient TAA-T expansion for clinical use (n = 1), out-of-specification release testing result (n = 1), withdrawal of consent (n = 1), ineligibility (n = 1) and death (n = 1). Of the patients enrolled on arm A who received TAA-T infusions, the median age was 5.5 years (range, 2–14) with four male and seven female participants.
A total of 28 patients with relapsed, refractory or recurrent high-risk nonbrainstem CNS malignancies were enrolled on arm B, and 18 of these patients were infused (Fig. 1a and Table 1). Two patients were not procured due to ineligibility, and eight procured patients were not infused due to insufficient TAA-T expansion (n = 6) or ineligibility (n = 2). Of the arm B patients who received TAA-T infusions, the median age was 13 years (range, 3–31) with ten male and eight female patients. Diagnoses included HGG (n = 7), medulloblastoma (MB; n = 6), ependymoma (EPN; n = 4) and pineoblastoma (PB; n = 1). In this cohort, 72.2% (n = 13) had metastatic disease. Patients had a median of two previous relapses/recurrences (range 0–4), and a median of six previous therapy courses for their disease (range 1–17).
Seven patients were enrolled on arm C, and four of these patients were infused (Fig. 1a and Table 1). Three patients were not infused due to insufficient TAA-T expansion for assigned DL (n = 2) and death (n = 1). Of the infused patients, the median age was 13.5 years (range 8–17), with two male and two female patients. Diagnoses included HGG (n = 2), MB (n = 1) and astroblastoma (AB; n = 1); 50% (n = 2) had metastatic disease.
Each patient’s specific diagnosis, molecular/disease characteristics (if known), age at diagnosis, age at enrollment, number/type of previous treatments, and number of previous relapses can be found in Table 2. Due to the limited sample size in arm C precluding meaningful inter-arm comparisons, and as arms B and C included the same recurrent/relapsed nonbrainstem CNS tumor patient population, these two arms were combined for all pooled analyses.
TAA-T cell product characteristics and manufacturing feasibility
Of 48 patients who were procured, 41 (85.4%) had autologous TAA-T cell products manufactured at DL1 or higher for infusion (Fig. 1a). Nine (18.8%) required dose reassignment to a lower dose level due to inadequate initial yield, prompting optimization of procurement and manufacturing methodologies (Methods, Manufacture of TAA-T products). As part of these changes, the median starting blood collection volume was 110 ml for the first 41.7% of procured participants and 200 ml for the remaining patients. After implementation of all procurement and manufacturing modifications, 100% (n = 14) of subsequently procured patients met DL1 or above for at least one infusion, without repeat manufacturing attempts. To assess the feasibility of supporting multiple infusions, we then evaluated the number of doses available at DL1 per manufacturing run before (n = 44) and after (n = 14) these modifications. The median number of available doses increased significantly after modifications from 3.8 to 11.0 (P < 0.01; Fig. 1c). Of these latter 14 manufacturing runs, 71.4% (n = 10) resulted in at least one full dose available at DL3.
TAA-T cell products were primarily comprised of CD3+ T cells with a mean of 92.4% and median of 96.9% (range, 31.3–99.6%) (Extended Data Fig. 1a–g). We observed heterogenous reactivity to TAA peptides across manufactured TAA-T cell infusion products (Extended Data Fig. 1h,i), and product specificity was determined based on IFNγ ELISpot as described in Methods (Supplementary Table 1).
Treatment details, safety profile and toxicities
The median number of infusions was two for both arm A (range, 1–5) and arm B (range, 1–4), with three arm B patients receiving four infusions. Arm C patients received a median of 2.5 infusions (range, 1–6; Extended Data Tables 1 and 2). In arm A, 54.5% (n = 6) of patients discontinued treatment due to clinical and/or radiographic progression, 9% (n = 1) due to performance status beneath the inclusion criterion threshold, and 36.4% (n = 4) due to depletion of all TAA-T products. In arms B and C, 50% (n = 11) of patients first discontinued treatment due to depletion of TAA-T product, 45.5% (n = 10) due to clinical and/or radiographic progression and 4.5% (n = 1) due to withdrawal of consent (Supplementary Table 2).
Safety was assessed according to the National Cancer Institute (NCI) Common Terminology Criteria for Adverse Events (CTCAE), v.5.0. Treatment was generally well tolerated in all arms, with 88% (293 of 332) of all adverse events (AEs) being low grade. Arms A and B independently dose-escalated to the same modified continual reassessment (mCRM)-estimated MTD and recommended phase 2 dose (RP2D): DL3. The most common treatment-emergent AEs (TEAEs), irrespective of attribution, included fatigue, headache and vomiting, with some differences in frequency between arms. In arm A, 72.7% (8 of 11) of participants experienced headache (grade 1, n = 7; grade 2, n = 1) and 45.5% (5 of 11) experienced nausea/vomiting or fatigue/lethargy (for both, grade 1, n = 3; grade 2, n = 1; grade 3, n = 1). In arms B and C, fatigue/lethargy (50.0%, 11 of 22 participants; grade 1, n = 10; grade 2, n = 1) and headache (31.8%, 7 of 22 participants; grade 1, n = 6; grade 3, n = 1) were most frequent (Fig. 2a,b). Arms B and C had similar AE profiles, except for transient, grade 3 cytopenias, which were seen in 100% (four of four) of patients in arm C. These were expected, owing to lymphodepleting conditioning and were thus excluded from combined safety analyses.
Across the study, grade ≥3 TEAEs at least possibly related to TAA-T therapy occurred in 9% of patients (n = 3). In arm A, these included brainstem edema, hydrocephalus and respiratory failure (all associated with patient P27). In arms B and C, grade ≥3 ataxia, muscle weakness lower limb, memory impairment, headache and cerebral edema were observed (associated with patients P02 and P42) (Extended Data Table 3). Two of these events were classified as serious AEs (SAEs). One SAE, a grade 5 event in arm A at DL2, was considered a dose-limiting toxicity (DLT). No additional DLTs occurred in any arm.
The DLT was observed in a patient with DIPG (P27), who had a pre-infusion tumor area of 2,585 mm2 and was infused 5.7 months from diagnosis. This patient developed hydrocephalus, tumor edema and respiratory distress 10 days after TAA-T infusion and did not improve despite placement of a ventriculoperitoneal shunt and increased steroid dose (4 mg dexamethasone bolus on days 1 and 3 of admission, in addition to pre-existing maintenance dose of 1.5 mg day−1). Imaging was consistent with progressive disease (PD). Nonetheless, this patient’s death prompted a pause in accrual, and treatment eligibility was amended to require neurological stability for at least 2 weeks (previously 1 week) with a shorter timeline between radiation and first infusion to ensure TAA-T administration preceded the typical window for disease progression. Following P27’s DLT, two additional patients were treated on arm A at DL2, and three additional patients at DL3, all without DLT.
One patient with progressive thalamic diffuse midline glioma (DMG), who had a pre-infusion tumor area of 3,496 mm2 was treated in arm B at DL1 and experienced a grade 3 SAE 16 days post-infusion (P42). This SAE consisted of MRI-documented cerebral edema accompanied by grade 3 headache, grade 1 vomiting, new-onset photophobia and tremor. Subsequent clinical worsening prompted treatment with bevacizumab, upon which, these events returned to baseline.
Retrospectively, all infused participants were evaluated for cytokine release syndrome (CRS) using the American Society for Transplantation and Cellular Therapy (ASTCT) consensus criteria. One participant had a temperature of 38.1 °C on day 6 post-infusion, with normal blood pressure and oxygen saturation, and no other AEs; this was coded as grade 1 CRS. Two other participants were febrile (≥38 °C), but were not classified as experiencing CRS, as their fevers had infectious or post-surgical etiologies.
Clinical responses
In arm A (DIPG), median PFS from time of diagnosis was 10.5 months (range, 6.2–19.5), and median OS from time of diagnosis was 13.7 months (range, 6.2–32.0), with no significant differences between DLs (Fig. 3a–c). Among the ten patients evaluable for objective radiographic response, best response post-infusion was stable disease (SD) in 60% (n = 6; two of whom had radiographic features consistent with pseudoprogression on the date of best response) and PD in 40% (n = 4; Extended Data Table 1).
In arms B/C, given the heterogeneity within the relapsed–refractory patient population, time zero for survival calculations was defined from the first TAA-T infusion, rather than diagnosis. Given these differing time origins, OS estimates are not directly comparable with arm A. Arm B/C median PFS was 5.0 months (range, 0.5–51.6), and median OS post-TAA-T infusion was 12.7 months (range, 6.3–61.1) (Fig. 4a–c). Ten patients were evaluable for objective radiographic response, including patients with HGG (n = 4; pediatric glioblastoma n = 1, DMG n = 3), EPN (n = 4) and MB (n = 2). Best response was SD in 50% (n = 5; two of whom had radiographic features consistent with pseudoprogression) and PD in 50% (n = 5). The median percent change in tumor area from baseline to best response was 10% (range, –93% to +91%; Fig. 4d and Extended Data Table 2). Among those with a best response of SD, four (80%) had a PFS of 5 months or longer (EPN n = 1, MB n = 2, HGG n = 1). One participant categorized as SD (P37) achieved a >90% lesion reduction; however, clinical deterioration occurred before confirmatory imaging could be obtained. Among patients with measurable disease, the patient with the smallest baseline tumor area (P25; 100 mm2), diagnosed with subgroup 4 MYC-amplified MB, had an OS of 3.5 years post-infusion.
Five patients with evidence of nonmeasurable disease at baseline were evaluable for nontarget response, including patients with HGG (n = 2; pediatric glioblastoma n = 1, DMG n = 1), MB (n = 2) and AB (n = 1), with best responses of complete response (CR; n = 1), SD (n = 3) and PD (n = 1). Among patients with nonmeasurable and evaluable disease, one (P31) remains alive more than 4 years post-infusion despite PD, and another (P41) remains alive more than 3 years post-infusion with continued radiographic CR (Fig. 4a,d,e, Extended Data Table 2 and Supplementary Fig. 1). Similarly, three of seven patients who had nonmeasurable nonevaluable disease pre-infusion survived 5 years post-infusion (P09) or remain alive without evidence of disease recurrence at over 2 and 4 years post-infusion (P35 and P36, respectively).
Brief clinical vignettes are provided for P41 to contextualize their radiographic CR, as well as for P35 and P36 to contextualize their prolonged, continued disease stability post-TAA-T therapy. Participant P41 enrolled on study as an 8-year-old child with an EWSR1-BEND2 rearranged AB involving the third ventricle. Upfront therapy consisted of resection and focal radiation. At recurrence, the patient completed re-irradiation approximately 7 months before the first TAA-T infusion, followed by several cycles of low-dose chemotherapy completed 2 months before infusion. On baseline pre-infusion MRI, third-ventricular disease was present (T1-weighted post-contrast and T2-FLAIR images; Fig. 4e and Supplementary Fig. 1a), although the proportion of viable tumor was difficult to definitively confirm (Supplementary Fig. 1b).
Participant P35 enrolled on study as a 14 year-old child with multiply relapsed World Health Organization (WHO) grade IV MB with anaplastic features, diagnosed at age 7 years and having experienced three previous recurrences. Before enrollment, the patient had received 17 distinct disease-directed therapies, including two courses of radiotherapy, three surgical resections, six chemotherapy regimens, multiple courses of bevacizumab and previous immunotherapy. Following completion of TAA-T therapy, the patient entered a prolonged period of radiographic stability while off all additional antitumor treatments.
Participant P36 enrolled on study as a 14 year-old child with recurrent pediatric glioblastoma (WHO grade IV; H3-wild-type, IDH-mutant, CDK4-amplified, low tumor mutational burden) that progressed following standard chemoradiation and investigational PARP inhibitor-based therapy. The patient experienced radiographic progression approximately 3 months before TAA-T infusion and underwent repeat surgical resection followed by temozolomide. During active TAA-T therapy, the patient did not receive any disease-directed concomitant therapies but began a few months of CDK4/6 inhibitor therapy following the final TAA-T cell infusion.
Exploratory immunobiological correlates
We performed T cell receptor (TCR) profiling to assess TAA-T cell persistence by longitudinally tracking product-derived clones in 3 of 11 infused patients in arm A, 12 of 18 patients in arm B, and 3 of 4 patients in arm C. Product-derived clonotypes were detectable post-infusion, and in several patients, dominant clones from the TAA-T cell infusion product persisted in blood up until the collection time point most proximate to confirmed disease progression. Evidence of clonal dynamics was apparent in some patients; the most common pattern detected was clonal expansion in week 2 post-infusion, followed by contraction at week 4 post-infusion (Extended Data Fig. 2 and Supplementary Figs. 2–4). Global TCR repertoire in peripheral blood was evaluated using Simpson clonality in 13 of 18 patients in arm B, and 4 of 4 patients in arm C. This metric also demonstrated transient clonal expansion in week 2 post-infusion (from baseline/pre-infusion for arm B and from week 1 post-infusion for arm C), followed by clonal contraction at week 4 post-infusion in a subset of patients (Extended Data Fig. 2g), though this metric is not specific to product-derived clonotypes. Together, these data may reflect dynamic biological activity of T cells post-infusion.
We next evaluated systemic immune activation by measuring IL-6, IL-8 (also known as CXCL8), CCL2 (also known as MCP1) and CXCL10 (also known as IP-10) plasma concentrations in blood samples collected at baseline (pre-infusion), weeks 1, 2 and 4 post-infusion and also from a sample proximate to confirmed disease progression (Extended Data Fig. 3a–h). We first examined these cytokines/chemokines across all treated patients by arm, accounting for inter-participant variability by analyzing longitudinal concentrations as log2-transformed fold change relative to each participant’s own pre-infusion baseline. Across patients, plasma IL-6 and IL-8 log2 fold changes were significantly increased at weeks 1 through 4 post-infusion (P < 0.05; Extended Data Fig. 4a–d). Although individual kinetics varied, in arm A, among patients demonstrating increases relative to baseline (n = 8), peak IL-6 and IL-8 log2 fold changes occurred at a median of 2 and 3 weeks post-infusion, respectively. Similarly, among arm B/C patients with such increases (n = 21 for IL-6 and n = 19 for IL-8), peak fold changes occurred at a median of 2 weeks post-infusion. A transient, significant increase in CCL2 at week 2 was demonstrated in arms B/C (day 14, P < 0.05; Extended Data Fig. 4e; though not arm A; Supplementary Fig. 5a), and there were no changes in CXCL10 in any arm (Supplementary Fig. 5b). Taken as a whole, these data indicate a systemic inflammatory response without evidence of IFN-associated chemokine induction.
No significant differences were observed between arm A and arms B/C when comparing IL-6, IL-8, CCL2 and CXCL10 log2FCs (from baseline; Supplementary Fig. 5c); therefore, all arms were pooled to investigate cytokines/chemokines in the setting of AEs. We first examined these markers in the context of the possibly related SAEs described above. For both SAEs, absolute maximum IL-6 concentrations remained <30 pg ml−1 at time points sampled before and after hospitalization (P42, 28.9 pg ml−1; P27, 17 pg ml−1; Extended Data Figs. 3a,c and 4f); these values are below thresholds associated with severe inflammatory toxicity as reported previously in literature18,19. Because associations between inflammatory toxicities and plasma concentration thresholds are less established for IL-8, CCL2 and CXCL10, we evaluated these levels relative to the entire cohort of participants sampled at the corresponding time points (n = 33; Extended Data Fig. 4f). For P42, maximal pre-SAE plasma IL-8, CCL2 and CXCL10 concentrations were in the third quartile, top quartile and second quartile, respectively, with post-admission CXCL10 increasing to the 75th percentile. In contrast, for P27, the IL-8, CCL2 and CXCL10 concentrations in the pre-SAE sample were in the first, second and second quartiles, respectively, with post-admission IL-8 increasing to the second quartile. Together, these data suggest that neither participant’s SAE was consistent with an IL-6-related mechanism, and that peri-SAE IL-8, CCL2 and CXCL10 levels were heterogeneous, limiting our interpretation of these as predictive biomarkers.
Continuing these analyses across all participants, maximum TEAE CTCAE grade was associated with differences in baseline-normalized maximum IL-6 and IL-8 concentrations post-infusion (P < 0.05), with IL-6 levels significantly higher in participants experiencing grade 2 versus grade 1 TEAEs (4,279 versus 197 pg ml−1; adjusted rank-based P < 0.05) (Extended Data Fig. 5a,b). Sensitivity analyses assessing outlier exclusion demonstrated that IL-8 findings, but not IL-6 findings, retained statistical significance (Supplementary Fig. 6a,b). In both primary and sensitivity analyses, no differences in maximum IL-6 or IL-8 concentration were observed between grade ≥3 versus lower-grade AEs. Beyond AE severity, higher cytokine concentrations were associated with a greater number of grade ≥2 TEAEs, whereby patients with maximum IL-6 or IL-8 concentrations ≥500 pg ml−1 experienced more TEAEs than those with <500 pg ml−1 elevations of these markers (P < 0.05; Extended Data Fig. 5c,d; robust to outlier exclusion, Supplementary Fig. 6c,d). Collectively, these findings indicate that elevated IL-6 and IL-8 levels are associated with moderate, but not severe, life-threatening or fatal TEAE burden.
Among all TEAEs, maculopapular (MP) rash was associated with these inflammatory markers. Maximum post-infusion IL-6 and IL-8 concentrations in patients with MP rash (n = 5) versus without (n = 26) were a median of 589 pg ml−1 (versus 9.6) and 8,255 pg ml−1 (versus 258), respectively (P < 0.01; Extended Data Fig. 5e,f; robust to outlier exclusion, Supplementary Fig. 6e,f). The median onset of MP rash was 21 days (range, 11–28) post-infusion.
Discussion
The ReMIND phase 1 trial reports results from a systemic multi-antigen T cell therapy for the treatment of pediatric brain tumors. While this study evaluates TAA-T therapy in CNS tumors, this multi-antigen TAA-T platform has been previously studied by our group in pediatric and adult nonCNS malignancies, including phase 1 trials using the same WT1/PRAME/survivin-targeting product in high-risk solid and hematologic tumors (NCT02789228, NCT02203903 and NCT03843294) with favorable preliminary safety profiles10,20,21. The present study also increased to a higher dose level, 8.0 × 10⁷ cells per m2, given anticipated differences in T cell trafficking in the CNS.
In this trial, we demonstrated that an autologous multi-antigen TAA-T therapy can generally be manufactured using peripheral blood from pediatric patients with high-risk CNS malignancies. We also showed that TAA-T cell infusions are well tolerated when administered intravenously with and without prescribed lymphodepletion. Additionally, we established a model-estimated MTD and RP2D of 8 × 10⁷ cells per m2 per dose for future studies. Of note, the empiric MTD was not reached, as no dose level reached the threshold of unacceptable toxicity. The majority of patients experienced only mild to moderate AEs. Only two patients experienced potentially related SAEs; both had the largest tumor areas represented in arms A and B (nonresectable brainstem and thalamic DMG, respectively).
This trial was not powered to evaluate efficacy, and although TAA-T cell therapy was associated with durable disease stabilization in some patients who would otherwise be expected to experience rapid progression, conclusions about clinical efficacy must await a more definitive trial. However, those patients who do continue to remain without progression also harbored minimal residual tumor at baseline, suggesting that tumor burden may influence response. Theoretically, a higher effector cell-to-tumor ratio could favor immune-mediated control, although this could also be due to other variables.
Three patients showed objective responses. Patient P41 (AB with an EWSR1-BEND2 rearrangement) achieved a CR 1 year after completion of three TAA-T cell infusions and remains disease-free 3 years later. While this is a rare tumor subtype with an incompletely defined natural history, and OS may be somewhat better than other recurrent HGGs22, durable CRs to available therapies remain uncommon. The delayed timing of best response relative to the final infusion raises the possibility that intravenously administered TAA-T cells may have persisted and/or initiated supportive immune processes that evolved over time. Patients P35 and P36 (recurrent MB and HGG, respectively) remain disease-free more than 2.6 and 4.3 years after TAA-T cell infusion.
Overall, across arms B and C, most participants were heavily pretreated before enrollment, and some pursued additional therapies after study treatment, limiting the extent to which survival can be solely attributed to TAA-T cell therapy23. Interpretation of pooled outcomes of arms B and C is further limited by the use of lymphodepletion in the latter arm, and the associated clinical and biological heterogeneity that may ensue. Although our study presents an interesting signal of potential response, the exploratory nature of efficacy-related observations in this phase 1 study must not be overlooked.
Arm A of the ReMIND trial permits cautious contextualization relative to recent phase 1 CAR-T cell trials for DIPG7,8,24,25,26. In contrast to the wholly systemic administration of T cells in ReMIND, the B7-H3 CAR-T cell study exclusively utilized the intracerebroventricular (ICV) route, and the GD2 CAR-T cell study primarily employed the same (although each patient’s first infusion was intravenous). Reported median OSs were 19.8 and 17.6 months, respectively7,24,26. Median OS for patients with DIPG treated on ReMIND was 13.7 months; two participants (P13 and P50) experienced prolonged survivals of 32 and 21 months, respectively, with the latter alive at last follow-up. While each of these studies harbors extraordinary responders and exceeds the generally accepted median OS of approximately 11 months, most children in all studies eventually died of disease, and other variables may have affected outcome (for example, re-irradiation). These findings have informed subsequent strategies aimed at enhancing tumor trafficking and immunogenicity, discussed below.
From a safety perspective, inflammatory toxicities including CRS and other high-grade AEs were common in the GD2 CAR-T cell trial, particularly following intravenous administration, whereas such events were less frequently observed following TAA-T therapy, suggesting a comparatively favorable safety profile in ReMIND. As TAA-T cells are expanded ex vivo without genetic modification and exert cytotoxicity through native TCRs, they may mitigate the inflammatory toxicity risks that are associated with CAR-T cells27,28,29,30.
Consistent with this, our exploratory immunocorrelative analyses demonstrate increases in early post-infusion proinflammatory plasma cytokines/chemokines IL-6, IL-8 and CCL2 across patients, suggestive of potential TAA-T-mediated bioactivity, with an association only with moderate but not high-grade AEs. Increased IL-8 (refs. 31,32,33,34,35,36,37,38,39,40,41,42) and CCL2 (refs. 43,44,45,46,47,48,49) have been shown to be associated with grade 2 CRS24, and CXCL10 has been shown to be associated with CAR-T toxicity50,51. Notably, we did not observe broad CXCL10 increases in our trial, suggesting that the absence of an interferon-associated chemokine signal may be a differentiator in the toxicity profile. Interpretation of cytokine and chemokine data must be undertaken with caution, as clinical and immunologic outcomes may also be influenced by patient‑specific factors, including baseline TCR repertoire diversity, T cell fitness, in vivo cellular milieu, and tumor genetics, as well as heterogeneity in manufactured TAA‑T cell products.
Advantages of this minimally manipulated, systemic, autologous T cell therapy (procured through venipuncture) include lower cost, reduced burden for patients, and quicker trial start-up compared to current viral vector-based CAR-T therapies. TAA-T cells retain the capacity to recognize multiple intracellular tumor antigens and are sensitive to low antigen density, whereas CAR-T cells traditionally require higher antigen density in order to exert their cytotoxic function52,53,54. Regarding the route of administration, intravenously infused activated T cells may confer immunologic effects that differ from ICV-administered products by enabling engagement of peripheral immune compartments, potentially facilitating interactions with host APCs and supporting secondary immune processes, including antigen spreading10 and enhanced persistence12,21,25,55,56,57,58.
However, despite the advantages of this approach, some infusion products, primarily those manufactured earlier in the trial, did not meet target dose, highlighting logistical challenges with the manufacturing process. Total cell numbers improved over the course of the study after optimization of procurement and manufacturing protocols. Future studies may benefit from collecting larger blood volumes and pre-defining feasibility-based halting rules to enable technical optimization and/or a transition to leukapheresis when target dosing cannot be achieved reliably. Such studies may require balancing total cell dose with frequency of infusions to identify a therapeutic target dose that is both feasible and efficacious.
Taken together, the encouraging results in ReMIND have prompted further investigation of this approach in two subsequent phase 1 trials: LIFT (under development; A Safety and Feasibility Study to Evaluate Blood–Brain Barrier Disruption Using Exablate MR-Guided Low Intensity Focused Ultrasound with Microbubbles in Combination with PRAME, Survivin and WT1-targeting Tumor-Associated Antigen-specific T Cell Infusion in Patients with Newly Diagnosed Diffuse Midline Glioma) and IMPACT (NCT06193759; Immunotherapy for Malignant Pediatric Brain Tumors Employing Adoptive Cellular Therapy). LIFT will examine utilization of low-frequency ultrasound to promote tumor incursion of ReMIND-type TAA-T cells as well as induce local immune microenvironment reprogramming59,60,61,62,63, and IMPACT is utilizing the same TAA-T cell platform against individualized neoantigens (rather than PRAME, survivin and WT1) in children with embryonal tumors and recurrent ependymoma.
The limitations of this study include obstacles that face all adoptive cellular therapies for pediatric CNS malignancies, including lack of sensitive methods to evaluate objective tumor response in the context of potential pseudoprogression, lack of direct measures of cytotoxic activity or evidence of T cell migration into the tumor, and significant heterogeneity in patient tumor phenotype, immunophenotype and clinical characteristics64. Future trials may consider pre-emptive ICV device placement, which could both enable intracranial pressure management and facilitate cerebrospinal fluid (CSF) sampling for correlative analyses with clinical response and AEs. Further development of TCR-sequencing assays, in tandem with development of liquid biopsy assays, may provide further insight into antitumor bioactivity. Last, tumor inflammation-associated neurotoxicity65 had not been widely recognized during the conduct of this trial, with the first reports of this phenomenon published after more than 90% of participants had undergone TAA-T cell therapy. Metrics that standardize reporting of neuroinflammation will be important in systematically comparing therapeutic strategies moving forward.
In summary, the ReMIND study utilized multi-antigen-specific T cell therapy for the treatment of predominantly pediatric patients with brain tumors. This study demonstrated both feasibility and safety in this patient population, as well as impressive clinical responses in some patients. Augmentation of T cell therapy via combinatorial immunoadjuvant approaches may improve efficacy, and novel imaging and systemic biomarkers of response are also being developed, which may provide more sensitive assessment of treatment response than currently available modalities.
Methods
Patients and treatment protocol
The clinical trial protocol was approved by the Children’s National Hospital Institutional Review Board (IRB), conducted under a US Food and Drug Administration-authorized Investigational New Drug (IND; 18059) and registered on ClinicalTrials.gov (NCT03652545). A data safety monitoring board (DSMB) oversaw the conduct of the trial, meeting annually to review AEs, SAEs and unanticipated problems involving risks to participants and others, and convening more frequently as needed if any safety stopping rule was met. Written informed consent was obtained from each patient or their legally authorized representative, in accordance with federal and local regulations, before each participant’s initiation of study-related activities. In addition, when applicable, verbal or written assent was obtained from patients aged 7–17 years who possessed the cognitive capacity to do so, in accordance with Children’s National Hospital IRB policies. The signed informed consent form included explicit patient or legally-authorized representative authorization for the use, sharing and publication of coded study data, including de-identified health information used, created or collected in the trial. The first participant enrolled on study on 18 September 2018 and the final participant enrolled on 18 July 2024, with a final data cutoff of 1 January 2026. Participants did not receive any financial compensation. Full eligibility criteria are provided in the ‘Eligibility criteria’ section below. These criteria were required to be met before blood procurement for manufacturing and prior to the initial and each subsequent TAA-T infusion.
The primary objectives of this study were to evaluate the safety/feasibility, and MTD of TAA-T cells, as well as to describe related toxicities in the above-described patient populations. Secondary objectives were to preliminarily assess the efficacy of TAA-T therapy as measured by clinical response (CR, PR or SD), PFS and OS; to correlate these clinical outcomes with TAA-T persistence and bioactivity; to characterize patient immunophenotypes pre- and post- infusion, including exploration of potential biomarkers of disease or product persistence; and to characterize the TAA-T cell products generated, including evaluation of antigen specificity. Biological sex, determined based on clinical parameters or self-report, was recorded (n = 16 males and n = 17 females infused); however, neither sex nor gender was considered in the study design given the generally even distribution of disease.
Dose escalation was conducted independently on arms A and B with a starting dose of 2 × 10⁷ cells per m2, and subsequent escalation to 4 × 10⁷ cells per m2, and 8 × 10⁷ cells per m2, as directed by the mCRM method66,67,68,69,70 after two to four patients at each DL completed their DLT monitoring period. Once the model-estimated MTD for arm B was identified, an expansion to treat a total of eight arm B participants at the MTD was completed to ensure safety, after which the protocol was amended to add arm C and this new arm opened to enrollment. Arm C patients received 3 days of lymphodepleting chemotherapy (30 mg m−2 day−1 fludarabine and 300 mg m−2 day−1 cyclophosphamide) on days −4 to −2 before their first TAA-T infusion (day 0) at the MTD for arm B. Accrual to arm C and to arm A (for MTD expansion) was discontinued before each cohort reaching its protocol-specified maximum sample size, at the discretion of the IND sponsor and for reasons unrelated to safety. Accordingly, due to the small arm C sample size, arms B and C were combined for post hoc pooled AE, survival and immune correlative analyses. These pooled results are descriptive and exploratory.
On all arms, patients evaluable for safety received at least one TAA-T infusion, with a maximum of eight infusions permitted in the context of disease stability and acceptable toxicity. Each infusion was administered intravenously over approximately 1–3 min in the outpatient clinic. The first and second TAA-T infusions were administered a minimum of 42 days apart, and subsequent infusions were administered a minimum of 28 days apart. There was no intra-patient dose escalation; however, when inadequate numbers of TAA-Ts were available, patients were allowed to receive a lower DL than assigned for their first or subsequent infusions.
Patients were taken off treatment if they experienced a DLT; received another cellular product; experienced clinical and/or radiographic disease progression not attributable to other causes (regardless of whether they subsequently received therapy for relapse/recurrence); failed to meet eligibility criteria for subsequent infusions; withdrew consent for further treatment; or received the last available dose of investigational product (based on manufactured TAA-T supply). They were considered off study upon completion of the protocol-defined long-term follow-up period; loss to follow-up; death; withdrawal of consent for further study follow-up; or removal from the study at the discretion of the Principal Investigator (PI).
Safety evaluation
To evaluate safety, patients were frequently monitored on an outpatient basis with collection of clinical laboratory measurements, vitals and physical exams through month 12 post-final TAA-T cell infusion. Despite study visits continuing through year 1 post-infusion, the DLT monitoring period spanned 6 weeks following the first infusion only. DLTs were defined as any of the following events, if determined to be TAA-T related (possibly, probably or definitely related): grade ≥3 infusion-related AEs and/or grade ≥4 nonhematological AE, grade ≥3 pneumonitis or uveitis or any unexpected grade ≥3 toxicity. DLT exceptions included TAA-T-related AEs secondary to pseudoprogession (immune-mediated tumor inflammation) that were rapidly and definitively correctable (for example, CSF flow obstruction, or new neurological deficits that resolved within 14 days after initiation of medical therapy) or that were retrospectively determined to be true tumor progression. For arm C, an additional DLT criterion was added in the context of the lymphodepletion: hematologic-DLT was defined as failure to recover to a peripheral absolute neutrophil count (ANC) > 500 m−3 and platelets >20,000 mm−2 by 50 days from the start of fludarabine and cyclophosphamide administration, not due to underlying malignancy or severe infection. Full criteria with all exceptions are provided in the protocol, which is included in Supplementary Information.
Toxicities were defined by the NCI CTCAE, v.5.0. Low-grade AEs were defined as grade 1 (mild) or grade 2 (moderate), and high-grade AEs were defined as grade 3 (severe), grade 4 (life-threatening) or grade 5 (fatal). The exception to using the CTCAE scale was for CRS, which was retrospectively assessed using the ASTCT consensus grading for CRS71.
Response evaluation
To evaluate disease response, Response Assessment in Pediatric Neuro-Oncology, Response Assessment in Neuro-Oncology and Immunotherapy Response Assessment in Neuro-Oncology (iRANO) recommendations were considered72,73,74,75,76. Response Assessment in Pediatric Neuro-Oncology was the overarching protocol-defined framework and its definitions were used for measurable lesions and best response assignment, with pseudoprogression considerations of iRANO applied to cases of pseudoprogression.
Baseline MRI was required within approximately 2 weeks before the first infusion; post-infusion imaging was obtained before the third infusion and approximately every 2–3 months thereafter. Measurable lesions were defined as those visible on at least two contiguous axial MRI slices and measuring ≥10 × 10 mm. For measurable disease, tumor area was calculated from the longest diameter and its perpendicular; when multiple lesions were present, summed areas were used. PD was defined as a ≥25% increase from smallest prior measurement (including baseline if this represented the smallest on-study sum). Pseudoprogression was defined as the radiographic increase in measurable disease followed by subsequent radiographic stabilization or improvement, in the absence of additional tumor-directed, non-anti-angiogenic therapy. Nonmeasurable but evaluable disease was assessed qualitatively, with complete disappearance of the lesion/s being categorized as a CR, unequivocal progression or new lesions as PD, and persistence without meeting either criterion as SD (non-CR/non-PD). Neurologic status, corticosteroid dosing and confirmatory imaging were incorporated into response assessments where applicable.
Eligibility criteria
Patients were eligible irrespective of their sex or gender. Separate eligibility checklists were used for procurement and TAA-T infusion, with some overlapping criteria.
For both procurement and infusion, inclusion criteria were diagnosis of high-risk CNS tumors (DIPG, HGG, MB, EPN, embryonal tumors, choroid plexus carcinoma and other aggressive CNS malignancies); Karnofsky/Lansky score ≥60% (patients unable to walk because of paralysis but up in a wheelchair were considered ambulatory); bilirubin ≤3 × upper limit of normal (ULN); aspartate aminotransferase (AST)/alanine aminotransferase (ALT) ≤ 5 × ULN; serum creatinine ≤1.0 mg dl−1 or 1.5 × ULN for age (whichever is higher); pulse oximetry >90% on room air; agreement to use contraceptive measures during study participation (when age appropriate); and ability of patient or parent/guardian to provide informed consent. Exclusion criteria for both were uncontrolled infections; known HIV infection; and pregnant or lactating females (pregnancy assessment performed for all patients >7 years; if childbearing potential per PI/Sub-Investigator discretion, pregnancy testing was required).
Procurement-specific inclusion criteria were group A (newly diagnosed DIPG): radiographic diagnosis with DIPG defined as tumors with a pontine epicenter and diffuse intrinsic involvement of the pons, with procurement within 12 weeks after completion of radiotherapy (procurement before radiotherapy also allowed); group B: recurrent, progressive or refractory disease after standard treatment without lymphodepletive conditioning; or group C: recurrent, progressive or refractory disease after standard treatment with lymphodepletive conditioning (refractory disease included high-risk tumors after completion of standard treatment or tumors with known poor cure rates with standard treatment); age 6 months to 80 years; ANC ≥ 750 µl−1, absolute lymphocyte count >500 µl−1, platelets ≥75,000; available pre-trial tumor tissue (optional but highly encouraged); sufficient size to provide blood volume for TAA-T generation; steroids anticipated to be weaned to ≤0.4 mg kg−1 day−1 dexamethasone or equivalent by infusion; and for patients residing outside the USA or Canada, attestation to remain near Children’s National Hospital for the initial DLT monitoring phase (42 days after first infusion) and for each required visit in the 28-day safety monitoring phase after subsequent infusions. Procurement-specific exclusion criteria were previous immunotherapy with an investigational agent within 28 days before procurement; previous history of allogeneic stem cell transplantation (patients who received autologous stem cell infusions remained eligible); and bulky tumor for groups B and C, defined as any evidence of uncal herniation or significant midline shift, significant brainstem component, or deemed overly bulky by the PI.
Infusion-specific inclusion criteria were steroids ≤0.4 mg kg−1 day−1 dexamethasone or equivalent; ANC > 750 µl−1 and platelets >75,000 for group C before first dose of lymphodepletion; last dose of myelosuppressive chemotherapy (including completion of radiotherapy for group A) ≥14 days before infusion or upon count recovery, last dose of investigational agent ≥28 days previously (extended if AEs occur beyond 28 days), last dose of biologic agent ≥7 days previously (extended if AEs occur beyond 7 days; recovery from all acute effects of previous surgery; stable neurologic exam for 2 weeks on stable or decreasing steroids before first infusion and stability for 1 week before subsequent infusion; agreement to a brief (<72 h) steroid course if clinically necessary; and for group A, initial infusion within 5 months of start of irradiation. Infusion-specific exclusion criteria were receipt of ATG, Campath or other immunosuppressive T cell monoclonal antibodies within 28 days of infusion; and bulky tumor for groups B and C, defined as any evidence of uncal herniation or significant midline shift, significant brainstem component or deemed overly bulky by the PI (for subsequent infusions, most recent disease assessments per standard of care were used).
Protocol amendments
Multiple protocol amendments were implemented over the course of the study to improve feasibility, safety monitoring and clinical implementation. Substantive changes are outlined by the protocol version below.
Protocol v.2.0 (IRB-approved December 2019) modified eligibility and manufacturing procedures, including restricting bulky tumor exclusion to the initial TAA-T infusion (eliminating the requirement for MRI before every subsequent infusion while maintaining PD as an off-treatment criterion), permitting bevacizumab without a washout period to allow management of cerebral edema, standardizing a 28-day washout for other investigational agents, increasing allowable blood collection volume to improve cell yield, and incorporating iRANO guidance on pseudoprogression to permit continued therapy in the setting of clinical and radiographic stability when true progression was uncertain. Protocol v.3.0 (IRB-approved July 2021) introduced group C, along with group C-specific DLT criteria. Additional updates included allowing infusion at a lower dose level than originally assigned when TAA-T cell yield was insufficient, extending survival follow-up from 1–5 years, incorporating CSF collection for immunocorrelative analyses when clinically feasible in patients with existing intracerebroventricular access devices, and modifying eligibility criteria to include an absolute lymphocyte count >500 µl−1 at procurement, stricter steroid requirements (≤0.4 mg kg−1 day−1 at the time of infusion), permission for procurement before radiotherapy in group A, and extension of neurological stability requirements to 2 weeks before the first infusion and 1 week before subsequent infusions.
Protocol v.4.0 (IRB-approved October 2022) increased the group B sample size to allow group C-to-B post-procurement crossover when insufficient product was available for treatment in group C, and revised group A eligibility to require first infusion within 5 months of initiating radiotherapy rather than from diagnosis. Protocol v.4.1 and v.4.2 (IRB-approved February 2023 and August 2024, respectively) included only minor amendments to implement a barcode-based inventory management system, to add capture of post-treatment therapies during long-term follow-up and to update IRB reporting requirements. Protocol v.4.3 updated discrepancies throughout the protocol and clarified that arm A survival is defined from date of diagnosis rather than from first infusion. Protocol v.4.4, the most up-to-date version, added attribution (licensing and source acknowledgment) for the clinical scales in the appendices; this version is included within Supplementary Information.
Statistics and reproducibility
Dose escalation was guided by a Bayesian mCRM, which was applied independently to arms A and B. A shallow dose–toxicity curve was anticipated based on previous human experience with ex vivo expanded, nongenetically modified cytotoxic T lymphocyte products. Accordingly, a logistic dose–toxicity model was specified; the model skeleton corresponded to prior predictive probabilities of DLT of 7.1%, 13.3% and 21.0% across the three dose levels. The first patient was treated at the lowest dose level. Patients were treated in cohorts of two, with escalation decisions made after at least two patients completed their 42-day DLT assessment period. Dose escalation was restricted to prespecified levels, dose level skipping was prohibited, and accrual was suspended if any stopping rule was met (any DLT or potentially related death). If a DLT occurred, and the DSMB and IRB concurred that accrual could continue, dose escalation was suspended for the subsequent patient. Accrual and escalation decisions were guided by ongoing model-based estimation of DLT probabilities with real-time toxicity monitoring. The target probability of acceptable toxicity was set to be no more than 20%; the model-estimated MTD and the RP2D were thus defined as the highest DL at which the probability of DLT was ≤20%.
As a phase 1 dose-finding study, participants were not randomized and investigators and study staff were not blinded. Sample size was predetermined by the operating characteristics of the mCRM, with anticipated treatment of two to four patients per dose level per arm, and a planned expansion of up to eight patients at the MTD; however, feasibility constraints of product manufacturing at assigned dose levels necessitated increases in the planned maximum enrollment to arm B, with five patients treated at DL1 and nine patients treated at the MTD. Owing to manufacturing limitations, US Food and Drug Administration permission was obtained and the protocol was subsequently amended to allow treatment of seven patients at lower-than-mCRM-assigned DLs, and their toxicity data informed the model. No observed data were excluded from the primary safety or dose-finding analyses.
Median OS and median PFS were analyzed. For arm A, PFS and OS were calculated as time from diagnosis to the earliest date of PD documentation and death, respectively. For arms B and C, PFS and OS were calculated as time from first TAA-T infusion to the earliest date of PD documentation and death, respectively. Patients without progression or death were censored at the time of data cutoff (1 January 2026). In cases where participants could not be reached for re-consent to the 5-year survival follow-up following the protocol amendment adding this requirement, the date of death for inclusion in the OS analysis was obtained from publicly available records.
Statistical analyses for Kaplan–Meier survival curves, product characteristics, AEs and immunobiological correlates were performed using GraphPad Prism v.10 (Dotmatics). Statistical significance was defined as a P value < 0.05. For analyses involving multiple comparisons, adjusted P values were used where applicable. Given the exploratory nature of these analyses, all P values should be interpreted with caution. Further, in analyses examining the association between AEs and cytokine levels, outliers were identified using the Robust Regression and Outlier removal (ROUT) method with Q = 1%. Primary analyses were conducted with all observed values retained; exploratory sensitivity analyses excluding the identified outliers were also performed and are provided in Supplementary Data.
No sex- or gender-based analyses were performed given the already small sample sizes and existing heterogeneity among clinical factors in this trial.
Manufacture of TAA-T cell products
TAA-T cells were manufactured in compliance with current good manufacturing practices (cGMP) appropriate for a phase 1 study, as described previously77,78. Peripheral blood for each patient’s TAA-T cell manufacture attempt was collected on two occasions, 1 week apart. Monocyte-derived dendritic cells (DCs) were generated from isolated peripheral blood mononuclear cells (PBMCs) via plastic adherence and cultured in CellGenix DC medium (CellGenix) in the presence of IL-4 (1,000 U ml−1) (R&D Systems) and granulocyte–macrophage colony-stimulating factor (GM-CSF; 800 U ml−1) (Sanofi). On culture day 5–6, DCs were matured using IL-4 (1,000 U ml−1), GM-CSF (800 U ml−1), IL-6 (100 ng ml−1; CellGenix), tumor necrosis factor (10 ng ml−1), IL-1β (10 ng ml−1) (R&D Systems) and lipopolysaccharide (30 ng ml−1) (Sigma-Aldrich). After 24 h, mature DCs were matured, irradiated (25 Gy) and incubated with peptide libraries consisting of 15-mer peptides overlapping by 11 amino acids spanning WT1, PRAME and survivin (100 ng per peptide per 5 × 10⁶ DCs; JPT). Antigen-specific T cells were generated by co-culture of the nonadherent fraction of PBMCs with peptide-loaded DCs at a 20:1–5:1 ratio in Irvine Click’s Combined with RPMI Medium (Fujifilm Irvine Scientific) supplemented with 10% Human AB Serum (Grifols Bio Supplies). For the initial T cell stimulation with peptide-loaded DCs, culture medium contained IL-6 (50 ng ml−1), IL-7 (5 ng ml−1), IL-12 (5 ng ml−1; Akron Bio) and IL-15 (2.5 ng ml−1; CellGenix). For the second stimulation (and optional third depending on expansion), T cells were co-cultured with peptide-loaded DCs (10:1 T cell-to-DC ratio was average but allowable range was 20:1–5:1 T cell-to-DC ratio) or PHA blasts (5:1–1:1 T cell-to-PHA blast ratio) in culture medium containing IL-7 (10 ng ml−1) and IL-2 (100 U ml−1; Clinigen).
Manufacturing feasibility was assessed among enrolled patients from whom cells were procured and manufacturing attempted at least once, regardless of whether the final product was infused. Manufacturing was considered unsuccessful if there was insufficient expansion of TAA-T cells to achieve at least one dose at DL1, or if the final product failed to meet release criteria specifications as defined in the Chemistry, Manufacturing and Controls section of the IND application.
Optimizations to manufacturing processes
In response to manufacturing failures after accrual began, three major modifications were implemented, including both protocol amendments and manufacturing process changes. For the latter, 28 of 48 participants (58.3%) who underwent procurement, the maximum permitted collection volume was increased from 120ml to 400 ml (3 ml kg−1 per draw) in a protocol amendment effective December 2019. Following additional investigation into the failures, an additional protocol amendment implemented in July 2021 introduced a procurement eligibility criterion for the final 14 participants (29.2%) requiring an absolute lymphocyte count >500 μl−1. In addition to these protocol-level changes, the manufacturing protocol was revised in March 2021 to improve scalability and yield, including plating dendritic cells in flasks rather than six-well plates, and stimulating T cells in G-Rex10 or G-Rex100 devices, rather than 24-well plates. These manufacturing changes went into effect for the latter 18 of 48 procured patients (37.5%).
Characterization of TAA-T cell products
Flow cytometry for TAA-T cell product phenotyping
Cells were counted using Trypan Blue and resuspended in PBS to achieve a concentration of 2 million cells per ml. A working solution of Fixable Live/Dead Stain was prepared by adding 1 µl of Fixable Live/Dead stock to 500 µl of PBS. Subsequently, 100 µl of the resuspended cells was distributed into the appropriate number of tubes, including one unstained, to yield 200,000 cells per tube. Each tube received 100 µl of Fixable Live/Dead Aqua (Thermo Fisher Scientific, cat. no. L34966) or Fixable Live/Dead Near IR (Thermo Fisher Scientific, cat. no. L34976) dye and was incubated in the dark for 20 min. Following incubation, cells were washed by adding 2 ml of MACSQuant Running Buffer (Miltenyi Biotec, cat. no. 130-092-747) and centrifuged at 400g for 5 min, and then resuspended in 100 µl of MACSQuant Running Buffer. An FcR blocking agent (Miltenyi Biotec, cat. no. 130-059-901) was added to the tubes for 5 min to prevent any nonspecific binding, followed by an appropriate antibody mix (shown in tables below), which was incubated in the dark for 15 min.
Antibodies for the pan leukocyte panel included CD14 Vio Blue (Miltenyi Biotec, cat. no. 130-110-524), CD19 FITC (Miltenyi Biotec, cat. no. 130-113-646), CD16 PE (Miltenyi Biotec, cat. no. 130-113-393), CD56 PE (Miltenyi Biotec, cat. no. 130-113-312), CD3 Per CP Vio-770 (Miltenyi Biotec, cat. no. 130-113-141), CD4 PE-Vio-770 (Miltenyi Biotec, cat. no. 130-113-227), CD45 APC (Miltenyi Biotec, cat. no. 130-110-633) and CD8 APC Vio-770 (Miltenyi Biotec, cat. no. 130-110-681).
Antibodies for the TCR/DC panel included TCRγδ Vio Blue (Miltenyi Biotec, cat. no.1 30-119-619), TCRαβ FITC (Miltenyi Biotec, cat. no. 130-113-538), CD83 PE (Miltenyi Biotec, cat. no. 130-110-503), CD3 Per CP Vio-770 (Miltenyi Biotec, cat. no. 130-113-141) and CD45 APC (Miltenyi Biotec, cat. no. 130-110-633).
Antibodies for the T/NK panel included CD8 FITC (Miltenyi Biotec, cat. no. 130-110-677), CD16 PE (Miltenyi Biotec, cat. no. 130-113-393), CD56 PE (Miltenyi Biotec, cat. no. 130-113-312), CD3 Per CP Vio-770 (Miltenyi Biotec, cat. no. 130-113-141), CD4 PE-Vio-770 (Miltenyi Biotec, cat. no. 130-113-227) and CD45 APC (Miltenyi Biotec, cat. no. 130-110-633).
Antibodies for the DC/monocyte panel included CD83 FITC (Miltenyi Biotec, cat. no. 130-110-507), CD19 PE (Miltenyi Biotec, cat. no. 130-113-646), CD3 Per CP Vio-770 (Miltenyi Biotec, cat. no. 130-113-141), CD14 PE-Vio-770 (Miltenyi Biotec, cat. no. 130-110-521) and CD45 APC (Miltenyi Biotec, cat. no.1 30-110-633).
Antibodies for the TCR/Memory panel included CCR7 FITC (Miltenyi Biotec, cat. no. 130-120-468), CD45RO PE (Miltenyi Biotec, cat. no. 130-113-559), CD3 Per CP Vio-770 (Miltenyi Biotec, cat. no. 130-113-141), TCRγδ PE-Vio-770 (Miltenyi Biotec, cat. no.1 30-113-513), TCRαβ (Miltenyi Biotec, cat. no. 130-113-535) and CD95 (Miltenyi Biotec, cat. no. 130-113-007).
After incubation, cells were washed twice by adding 2 ml of MACSQuant buffer and centrifuging at 400g for 5 min. Cells were resuspended in 200 µl of MACSQuant and acquired on a flow cytometer, either MACSQuant (Miltenyi Biotec, Sr# 2595, eight colors), BD Canto (BD Biosciences, Sr# R33896002642, six colors) or CytoFLEX (Beckman Coulter, Sr# BD13018, eight colors). A CD Chex control (Streck, cat. no. 213365) was included with each product to ensure accurate staining and reliable results. Data analysis was performed using FlowJo software.
IFNγ ELISpot assay
This assay was performed as previously described79,80,81. TAA-T cell products were determined specific by ELISpot using the empirical method if any of the wells with individual TAA peptide pools (WT1, PRAME and survivin), or combined TAA peptide mix containing all three TAA peptide libraries, induced spot counts of 10 or higher and over three times higher than background. The background cutoff was calculated by averaging background wells (cells with medium only) and multiplying by three.
Immunobiology correlative assays
For correlative immune studies, whole blood research samples were collected in sodium heparin tubes before a participant’s first infusion and at each post-infusion study visit. During the safety monitoring period, study visits were conducted within a ± 3-day compliance window; therefore, time points referred to as ‘day 7’ or ‘week 1,’ etc. reflect this allowable range and may include minor inter-participant variability. PBMCs were cryopreserved and plasma was frozen according to standard procedures for later batch analyses.
ImmunoSEQ TCR repertoire and clonal tracking analysis
TCR sequencing was performed for all patients in arms B/C who had infusion products available. In those patients, infusion product and PBMC samples were sequenced and analyzed at these time points: baseline/pre-infusion no. 1 (arm B) or week 1 post-infusion (arm C), week 2 post-infusion, week 4 post-infusion, and at the time point most proximate to disease progression. Though arm A had additional patients with available infusion products remaining, sponsor chose not to send additional samples for sequencing beyond the initial four patients. Available samples for each patient were analyzed in immunoSEQ software (Adaptive Biotechnologies) using the ‘Amino Acid Only’ parameter of the Track Rearrangements tool. Data were ordered by infusion product, baseline PBMC sample, and then chronologically for post-infusion PBMC samples. Week 1 post-infusion was chosen as the initial time point for arm C due to lack of PBMCs available at baseline/pre-infusion caused from lymphodepletive conditioning.
Beyond the patients above for arms B/C, PBMCs at the time points specified above were sequenced for one additional patient in arm B (P36) and one additional patient in arm C (P41); infusion product was unavailable; however, longitudinal PBMC samples were sequenced and included for global repertoire analysis. Adaptive Biotechnologies also reports several different measures of TCR repertoire, including Simpson clonality, using the diversity metrics tool within the analyzer. Simpson clonality measures distribution of clones in a repertoire, where a value of zero indicates that the repertoire is perfectly diverse (no clonal duplication), with higher values indicating dominance by a few clones, and a value of one indicating that the repertoire is perfectly monoclonal82. An increase in Simpson clonality thus represents clonal expansion in a population, and respectively, a decrease in Simpson clonality represents clonal contraction in a population.
ELLA immunoassay
Custom cartridges for the ELLA Automated ELISA system (Bio-Techne) were used to profile cytokine IL-6, IL-8, CCL2 and CXCL10 in patient plasma samples from five different time points. Each cartridge enabled simultaneous analysis of up to 32 samples. High and low controls for each analyte were prepared according to manufacturer’s guidelines. Plasma samples were thawed on ice for 1 h before assay set up, and then centrifuged briefly. Appropriate dilutions were made based on data previously obtained. A total of 50 µl of each diluted sample, along with high and low controls, was loaded into designated wells on the cartridge. Assay buffer was added to the corresponding buffer wells as indicated on the cartridge. The ELLA system performs each measurement in duplicates, and the resulting data provides the average concentration of each analyte in pg ml−1, adjusted for the dilution factor used during sample preparation.
Reporting summary
Further information on research design is available in the Nature Portfolio Reporting Summary linked to this article.
Data availability
Individual‑level clinical and molecular data, beyond those contained within this paper, are not provided or deposited in a public repository due to considerations related to informed consent, data governance and privacy regulations. Requests for additional or more granular information may be directed at E.I.H. or C.M.B. These requests will be evaluated in accordance with applicable federal and local regulations and institutional policies, and a response made within 7 days of request receipt. Source data are provided with this paper.
References
Minturn, J. E. & Fisher, M. J. Gliomas in children. Curr. Treat. Options Neurol. 15, 316–327 (2013).
Coleman, C. et al. Interdisciplinary care of children with diffuse midline glioma. Neoplasia 35, 100851 (2023).
Cooney, T. et al. Contemporary survival endpoints: an International Diffuse Intrinsic Pontine Glioma Registry study. Neuro. Oncol. 19, 1279–1280 (2017).
Mackay, A. et al. Integrated molecular meta-analysis of 1,000 pediatric high-grade and diffuse intrinsic pontine glioma. Cancer Cell 32, 520–537.e5 (2017).
Alemany, M., Velasco, R., Simó, M. & Bruna, J. Late effects of cancer treatment: consequences for long-term brain cancer survivors. Neurooncol. Pract. 8, 18–30 (2020).
Hont, A. B. et al. The generation and application of antigen-specific T cell therapies for cancer and viral-associated disease. Mol. Ther. 30, 2130–2152 (2022).
Vitanza, N. A. et al. Intracerebroventricular B7-H3-targeting CAR T cells for diffuse intrinsic pontine glioma: a phase 1 trial. Nat. Med. 31, 861–868 (2025).
Vitanza, N. A. et al. Locoregional infusion of HER2-specific CAR T cells in children and young adults with recurrent or refractory CNS tumors: an interim analysis. Nat. Med. 27, 1544–1552 (2021).
Wang, S. S., Bandopadhayay, P. & Jenkins, M. R. Towards immunotherapy for pediatric brain tumors. Trends Immunol. 40, 748–761 (2019).
Hont, A. B. et al. Immunotherapy of relapsed and refractory solid tumors with ex vivo expanded multi-tumor associated antigen specific cytotoxic T lymphocytes: a phase I study. J. Clin. Oncol. 37, 2349–2359 (2019).
CAR T cells infiltrate brain, target tumors. Cancer Discov. 7, 926 (2017).
O’Rourke, D. M. et al. A single dose of peripherally infused EGFRvIII-directed CAR T cells mediates antigen loss and induces adaptive resistance in patients with recurrent glioblastoma. Sci. Transl. Med. 9, eaaa0984 (2017).
G, G. et al. Immunoexpression of survivin and P53 in the histological subtypes of medulloblastoma: a cross-sectional observational study. Cureus 16, e65627 (2024).
Hashii, Y. et al. Encouraging clinical evolution of a pediatric patient with relapsed diffuse midline glioma who underwent WT1-targeting immunotherapy: a case report and literature review. Front. Oncol. 10, 1188 (2020).
Lee, S. et al. Differential expression of Wilms’ tumor protein in diffuse intrinsic pontine glioma. J. Neuropathol. Exp. Neurol. 78, 380–388 (2019).
Vulcani-Freitas, T. M., Saba-Silva, N., Cappellano, A., Cavalheiro, S. & de Toledo, S. R. C. PRAME gene expression profile in medulloblastoma. Arq. Neuropsiquiatr. 69, 9–12 (2011).
Zhang, J. G. et al. Tumor antigen precursor protein profiles of adult and pediatric brain tumors identify potential targets for immunotherapy. J. Neurooncol. 88, 65–76 (2008).
Caimi, P. F. et al. Prophylactic tocilizumab prior to anti-CD19 CAR-T cell therapy for non-Hodgkin lymphoma. Front. Immunol. 12, 745320 (2021).
Teachey, D. T. et al. Identification of predictive biomarkers for cytokine release syndrome after chimeric antigen receptor T-cell therapy for acute lymphoblastic leukemia. Cancer Discov. 6, 664–679 (2016).
Kinoshita, H. et al. Outcome of donor-derived TAA-T cell therapy in patients with high-risk or relapsed acute leukemia post allogeneic BMT. Blood Adv. 6, 2520–2534 (2022).
Dave, H. et al. Tumor-associated antigen-specific T cells with nivolumab are safe and persist in vivo in relapsed/refractory Hodgkin lymphoma. Blood Adv. 6, 473–485 (2022).
Lucas, C.-H. G. et al. EWSR1-BEND2 fusion defines an epigenetically distinct subtype of astroblastoma. Acta Neuropathol. 143, 109–113 (2022).
Grill, J. et al. PDCT-01. Biological medicine for diffuse intrinsic pontine gliomas eradication (BIOMEDE): results of the three-arm biomarker-driven randomized trial in the first 230 patients from Europe and Australia. Neuro. Oncol. 21, vi183 (2019).
Monje, M. et al. Intravenous and intracranial GD2-CAR T cells for H3K27M+ diffuse midline gliomas. Nature 637, 708–715 (2025).
Majzner, R. G. et al. GD2-CAR T cell therapy for H3K27M-mutated diffuse midline gliomas. Nature 603, 934–941 (2022).
Vitanza, N. A. et al. Intraventricular B7-H3 CAR T cells for diffuse intrinsic pontine glioma: preliminary first-in-human bioactivity and safety. Cancer Discov. 13, 114–131 (2023).
Nguyen, K. A. et al. CD22 TCR-engineered T cells exert antileukemia cytotoxicity without causing inflammatory responses. Sci. Adv. 11, eadq4297 (2025).
Korell, F., Berger, T. R. & Maus, M. V. Understanding CAR T cell-tumor interactions: paving the way for successful clinical outcomes. Medicine 3, 538–564 (2022).
Fischer, J. W. & Bhattarai, N. CAR-T cell therapy: mechanism, management, and mitigation of inflammatory toxicities. Front. Immunol. 12, 693016 (2021).
Peters, D. T., Savoldo, B. & Grover, N. S. Building safety into CAR-T therapy. Hum. Vaccin. Immunother. 19, 2275457 (2023).
Brat, D. J., Bellail, A. C. & Van Meir, E. G. The role of interleukin-8 and its receptors in gliomagenesis and tumoral angiogenesis. Neuro. Oncol. 7, 122–133 (2005).
Fousek, K., Horn, L. A. & Palena, C. Interleukin-8: a chemokine at the intersection of cancer plasticity, angiogenesis, and immune suppression. Pharmacol. Ther. 219, 107692 (2021).
Hasan, T. et al. Interleukin-8/CXCR2 signaling regulates therapy-induced plasticity and enhances tumorigenicity in glioblastoma. Cell Death Dis. 10, 292 (2019).
Hayden, E. et al. Therapeutic targets in diffuse midline gliomas—an emerging landscape. Cancers 13, 6251 (2021).
Holst, C. B. et al. Plasma IL-8 and ICOSLG as prognostic biomarkers in glioblastoma. Neuro. Oncol. Adv. 3, vdab072 (2021).
Lin, H. et al. Understanding the immunosuppressive microenvironment of glioma: mechanistic insights and clinical perspectives. J. Hematol. Oncol. 17, 31 (2024).
Liu, H. et al. Neutralizing IL-8 potentiates immune checkpoint blockade efficacy for glioma. Cancer Cell 41, 693–710.e8 (2023).
Pachocki, C. J. & Hol, E. M. Current perspectives on diffuse midline glioma and a different role for the immune microenvironment compared to glioblastoma. J. Neuroinflamm. 19, 276 (2022).
Sharma, I., Singh, A., Siraj, F. & Saxena, S. IL-8/CXCR1/2 signalling promotes tumor cell proliferation, invasion and vascular mimicry in glioblastoma. J. Biomed. Sci. 25, 62 (2018).
Van Den Broek, T. J. M. et al. Single-cell spatial analysis of pediatric high-grade glioma reveals a novel population of SPP1+/GPNMB+ myeloid cells with immunosuppressive and tumor-promoting capabilities. Neurooncol. Pediatr. 1, wuaf002 (2025).
Van den Ende, B. et al. Exploring the tumor microenvironment in diffuse intrinsic pontine glioma: immunological insights and therapeutic challenges. J. Immunother. Cancer 13, e012009 (2025).
Yuan, W. et al. Dual role of CXCL8 in maintaining the mesenchymal state of glioblastoma stem cells and M2-like tumor-associated macrophages. Clin. Cancer Res. 29, 3779–3792 (2023).
Vakilian, A. et al. CCL2/CCR2 signaling pathway in glioblastoma multiforme. Neurochem. Int. 103, 1–7 (2017).
Zhou, Q. et al. Noninvasive prediction of CCL2 expression level in high-grade glioma patients. Cancer Med. 13, e70016 (2024).
Chang, A. L. et al. CCL2 produced by the glioma microenvironment is essential for the recruitment of regulatory T cells and myeloid-derived suppressor cells. Cancer Res. 76, 5671–5682 (2016).
Chang, A. L. et al. Glioma microenvironment-derived CCL2 recruits regulatory T cells and myeloid-derived suppressor cells. J. Immunother. Cancer 3, P72 (2015).
Deng, L. et al. Predictive value of CCL2 in the prognosis and immunotherapy response of glioblastoma multiforme. BMC Genomics 24, 746 (2023).
Hajal, C. et al. The CCL2-CCR2 astrocyte-cancer cell axis in tumor extravasation at the brain. Sci. Adv. 7, eabg8139 (2021).
Takacs, G. P. et al. Glioma-derived CCL2 and CCL7 mediate migration of immune suppressive CCR2+/CX3CR1+ M-MDSCs into the tumor microenvironment in a redundant manner. Front. Immunol. 13, 993444 (2022).
Gust, J., Ponce, R., Liles, W. C., Garden, G. A. & Turtle, C. J. Cytokines in CAR T cell-associated neurotoxicity. Front. Immunol. 11, 577027 (2020).
Murthy, H. S. et al. Management of CAR T-cell related toxicities: what did the learning curve teach us so far? Hematol. Oncol. Stem Cell Ther. 15, 100–111 (2022).
Salter, A. I. et al. Comparative analysis of TCR and CAR signaling informs CAR designs with superior antigen sensitivity and in vivo function. Sci. Signal. 14, eabe2606 (2021).
Majzner, R. G. et al. Tuning the antigen density requirement for CAR T-cell activity. Cancer Discov. 10, 702–723 (2020).
Ramakrishna, S. et al. Modulation of target antigen density improves CAR T-cell functionality and persistence. Clin. Cancer Res. 25, 5329–5341 (2019).
Musher, B. L. et al. Autologous multiantigen-targeted T cell therapy for pancreatic cancer: a phase 1/2 trial. Nat. Med. 32, 258–269 (2026).
Dolton, G. et al. Targeting of multiple tumor-associated antigens by individual T cell receptors during successful cancer immunotherapy. Cell 186, 3333–3349.e27 (2023).
Zhou, J., Dudley, M. E., Rosenberg, S. A. & Robbins, P. F. Persistence of multiple tumor-specific T-cell clones is associated with complete tumor regression in a melanoma patient receiving adoptive cell transfer therapy. J. Immunother. 28, 53–62 (2005).
Pai, J. A. et al. Lineage tracing reveals clonal progenitors and long-term persistence of tumor-specific T cells during immune checkpoint blockade. Cancer Cell 41, 776–790.e7 (2023).
Haydar, D. et al. CAR T-cell design-dependent remodeling of the brain tumor immune microenvironment modulates tumor-associated macrophages and anti-glioma activity. Cancer Res. Commun. 3, 2430–2446 (2023).
Kovacs, Z. I. et al. Disrupting the blood-brain barrier by focused ultrasound induces sterile inflammation. Proc. Natl Acad. Sci. USA 114, E75–E84 (2017).
Kline-Schoder, A. R. et al. Characterization of the responses of brain macrophages to focused ultrasound-mediated blood–brain barrier opening. Nat. Biomed. Eng 8, 650–663 (2024).
Choi, H. J. et al. The new insight into the inflammatory response following focused ultrasound-mediated blood–brain barrier disruption. Fluids Barriers CNS 19, 103 (2022).
Obradovic, A. et al. Single-cell protein activity analysis identifies recurrence-associated renal tumor macrophages. Cell 184, 2988–3005.e16 (2021).
Ronsley, R. et al. CAR T cell therapy for pediatric central nervous system tumors: a review of the literature and current North American trials. Cancer Metastasis Rev. 43, 1205–1216 (2024).
Mahdi, J. et al. Tumor inflammation-associated neurotoxicity. Nat. Med. 29, 803–810 (2023).
Goodman, S. N., Zahurak, M. L. & Piantadosi, S. Some practical improvements in the continual reassessment method for phase I studies. Stat. Med. 14, 1149–1161 (1995).
Heyd, J. M. & Carlin, B. P. Adaptive design improvements in the continual reassessment method for phase I studies. Stat. Med. 18, 1307–1321 (1999).
Korn, E. L. et al. A comparison of two phase I trial designs. Stat. Med. 13, 1799–1806 (1994).
Le Tourneau, C., Lee, J. J. & Siu, L. L. Dose escalation methods in phase I cancer clinical trials. J. Natl Cancer Inst. 101, 708–720 (2009).
Piantadosi, S., Fisher, J. D. & Grossman, S. Practical implementation of a modified continual reassessment method for dose-finding trials. Cancer Chemother. Pharmacol. 41, 429–436 (1998).
Lee, D. W. et al. ASTCT consensus grading for cytokine release syndrome and neurologic toxicity associated with immune effector cells. Biol. Blood Marrow Transplant 25, 625–638 (2019).
Cooney, T. M. et al. Response assessment in diffuse intrinsic pontine glioma: recommendations from the Response Assessment in Pediatric Neuro-Oncology (RAPNO) working group. Lancet Oncol. 21, e330–e336 (2020).
Erker, C. et al. Response assessment in paediatric high-grade glioma: recommendations from the Response Assessment in Pediatric Neuro-Oncology (RAPNO) working group. Lancet Oncol. 21, e317–e329 (2020).
Warren, K. E. et al. Response assessment in medulloblastoma and leptomeningeal seeding tumors: recommendations from the Response Assessment in Pediatric Neuro-Oncology committee. Neuro. Oncol. 20, 13–23 (2018).
Wen, P. Y. et al. Response assessment in neuro-oncology clinical trials. J. Clin. Oncol. 35, 2439–2449 (2017).
Okada, H. et al. Immunotherapy response assessment in neuro-oncology: a report of the RANO working group. Lancet Oncol. 16, e534–e542 (2015).
Weber, G. et al. Generation of tumor antigen-specific T cell lines from pediatric patients with acute lymphoblastic leukemia–implications for immunotherapy. Clin. Cancer Res. 19, 5079–5091 (2013).
Weber, G. et al. Generation of multi-leukemia antigen-specific T cells to enhance the graft-versus-leukemia effect after allogeneic stem cell transplant. Leukemia 27, 1538–1547 (2013).
Kalyuzhny, A. E. (ed.) Handbook of ELISPOT Vol. 792 (Humana, 2012).
Moodie, Z. et al. Response definition criteria for ELISPOT assays revisited. Cancer Immunol. Immunother. 59, 1489–1501 (2010).
Moodie, Z., Huang, Y., Gu, L., Hural, J. & Self, S. G. Statistical positivity criteria for the analysis of ELISpot assay data in HIV-1 vaccine trials. J. Immunol. Methods 315, 121–132 (2006).
Chiffelle, J. et al. T-cell repertoire analysis and metrics of diversity and clonality. Curr. Opin. Biotechnol. 65, 284–295 (2020).
Acknowledgements
We thank the referring and treating physicians of our participants: T. B. Alexander, M. Abromowitch, M. P. Atlas, J. T. Felker, C. T. Jacobsen, K. Kramer, D. E. Kram, C. Kotch, K. Laurie, M. Mark, E. Minturn, Y. Odia, A. S. Plant, B. W. Purow, S. L. Stapleton, C. J. Twist, Z. J. Wang and D. J. Zinn. We also thank G. Paul, C. Lazarski, G. Pezzella, M. Wachspress, D. Ayala-Gomez, H. Lang and N. Maghzian for laboratory support, and M. Fernanda Fortiz, K. Fulton, S. Fatima, M. Mamlouk, S. Benothmane, E. Joy and C. Cer for regulatory and operational support. Above all, we extend our gratitude to the patients who participated in this study and to their caregivers. We thank our generous funding sources, including anonymous private investors supporting the Children’s National Hospital Brain Tumor Institute; the Chance for Life Foundation (awarded to E.I.H.); the Willie Strong Foundation (awarded to E.I.H.); the Warrior Jace Foundation (awarded to E.I.H.); Cancer Grand Challenges (Team NexTGen), funded through a partnership between Cancer Research UK (CGCATF-2021/100003), the NCI (CA278700-01) and The Mark Foundation for Cancer Research (awarded to C.M.B.); support for S.G. from the GW T32 Cancer Biology Program (National Institutes of Health/NCI T32 CA247756) and the Momentum Fellowship (The Mark Foundation for Cancer Research); and support for M.L.G. from the Rally Foundation Fellowship and Young Investigator Awards.
Author information
Authors and Affiliations
Contributions
Conceptualization: C.M.B. and E.I.H. Methodology: A.Z. Validation: S.G., R.A.D., D.K. and A.D. Formal analysis: S.G., R.A.D. and A.Z. Investigation: R.A.D., A.E.G., M.L.G., E.R., A.D., C.D.M., J.T., D.K., F.H., P.J.H., J.L.W., L.B.K., B.R.R., A.F., L.G.V., C.R.Y.C. and E.I.H. Resources: C.M.B. and E.I.H. Data curation: C.D.M., S.G., R.A.D. and D.K. Writing—original draft: S.G., R.A.D., C.D.M. and A.D. Writing—review & editing: S.G., R.A.D., A.E.G., M.L.G., E.R., A.D., C.D.M., J.T., D.K., F.H., A.Z., P.J.H., J.L.W., L.B.K., B.R.R., A.F., H.J.M., L.G.V., R.J.P., C.R.Y.C., C.M.B. and E.I.H. Visualization: S.G. and R.A.D. Supervision: C.M.B. and E.I.H. Project administration: R.A.D., M.L.G. and S.G. Funding acquisition: C.M.B. and E.I.H.
Corresponding authors
Ethics declarations
Competing interests
E.I.H., P.J.H., L.B.K., C.M.B. and C.R.Y.C. declare the following competing interests. E.I.H. is on the MAB or has consulted for DayOne Therapeutics and Fennec Pharmaceuticals. P.J.H. is on the board of (or an advisor to) Autolomous, Cipla, Cellenkos, CARTx, MFX, March Bio and Y Innovations. L.B.K. is a consultant for Blueprint Medicine (DSMB) and Chimerix -a Jazz company (advisory board). C.M.B. is on the board of directors of Cabaletta Bio on the scientific advisory board of Minovia TX, and she has recently served on the DSMB of SOBI. C.R.Y.C., P.J.H. and C.M.B. are inventors on patent applications filed by Children’s National Hospital (Children’s National Medical Center) related to TAA-T therapies. These include PCT/US2019/033182, which covers the generation and use of T cells targeting TAAs (including PRAME, WT1 and survivin) as described in this paper. Additional patent applications related to TAA-specific T cell compositions and methods (PCT/US2019/028589 and PCT/US2020/012639) are listed as pending in public records, though the institution has instructed patent counsel to abandon these applications; patent application PCT/US2021/035008 is a pending patent application related to TAA-T cells. These additional filings do not specifically cover the clinical study reported here. The other authors declare no competing interests.
Peer review
Peer review information
Nature Medicine thanks Jessica Foster, David Ziegler and the other, anonymous, reviewer(s) for their contribution to the peer review of this work. Peer reviewer reports are available. Primary Handling Editor: Saheli Sadanand, in collaboration with the Nature Medicine team.
Additional information
Publisher’s note Springer Nature remains neutral with regard to jurisdictional claims in published maps and institutional affiliations.
Extended data
Extended Data Fig. 1 Characterization of autologous TAA-T cell products.
Flow immunophenotyping release testing data are presented in A-G and IFNγ ELISpot data presented in H-K (Arm A: n = 12; Arms B/C: n = 27). Each data point represents a separate TAA-T cell product infused into patients (biological replicates). Lower whisker is defined as the minima, upper whisker is defined as the maxima, center is defined as median, lower bound of box is defined as Q1 (25th percentile), and upper bound of box is defined as Q3 (75th percentile). a) % Total T cells (CD3 + ). Arm A: Minima=51, Maxima=99, Median=97, 25th Percentile=95, 75th Percentile=99; Arms B/C: Minima=31, Maxima=100, Median=97, 25th Percentile=94, 75th Percentile=98. b) % CD4 + T cells (CD3 + CD4+ of CD45 + ). Arm A: Minima=0.50, Maxima=88, Median=16, 25th Percentile=2.6, 75th Percentile=38; Arms B/C: Minima=0.40, Maxima=55, Median=9.9, 25th Percentile=6.1, 75th Percentile=17. c) %CD8 + T cells (% CD3 + CD8+ of CD45 + ). Arm A: Minima=4.3, Maxima=88, Median=37, 25th Percentile=22, 75th Percentile=47; Arms B/C: Minima=19, Maxima=91, Median=51, 25th Percentile=36, 75th Percentile=71. d) % αβ T cells (% TCRαβ+ of CD3 + ). Arm A: Minima=8.2, Maxima=94, Median=69, 25th Percentile=28, 75th Percentile=86; Arms B/C: Minima=32, Maxima=98, Median=71, 25th Percentile=48, 75th Percentile=84. e) % γδ T cells (% TCRγδ+ of CD3 + ). Arm A: Minima=5.1, Maxima=79, Median=28, 25th Percentile=8.4, 75th Percentile=67; Arms B/C: Minima=1.1, Maxima=83, Median=25, 25th Percentile=10, 75th Percentile=53. f) % CD3 + CD16 + CD56+ of CD45 + . Arm A: Minima=2.8, Maxima=25, Median=11, 25th Percentile=7.2, 75th Percentile=17; Arms B/C: Minima=3.4, Maxima=64, Median=16, 25th Percentile=8.1, 75th Percentile=28. g) % NK cells (CD16/CD56 + CD3- of CD45 + ). Arm A: Minima=0.40, Maxima=48, Median=1.0, 25th Percentile=0.48, 75th Percentile=4.6; Arms B/C: Minima=0.10, Maxima=62, Median=1.6, 25th Percentile=0.60, 75th Percentile=6.1. h-i) IFNγ ELISpot with background correction for Arm A (h) and Arms B/C (i). Negative values after background normalization have been normalized to zero for visual representation.
Extended Data Fig. 2 Clonal Persistence and Global TCR Repertoire Dynamics.
a-f) Longitudinal tracking of product‑derived clonotypes for assayed participants who received infusion of specific TAA‑T products. Time points corresponding to disease progression (if applicable) are indicated by the downward black arrow. Abbreviations: “Pre” = prior to first TAA‑T cell infusion; I = infusion; W = week; M = month. (a) P09 (Arm B). b) P12 (Arm B). c) P10 (Arm A). d) P20 (Arm B). e) P26 (Arm B). f) P35 (Arm B). g) Global TCR Repertoire Dynamics (Arms B/C) – Simpson Clonality. Color coding indicates participants with increases in Simpson’s Clonality relative to baseline. Baseline PBMC samples are from the pre-infusion time point for Arm B. For Arm C patients, post lymphodepletion, pre-infusion samples were not available for all patients so week 1 post-infusion was first available time point sampled longitudinally.
Extended Data Fig. 3 Cytokines and Chemokines.
Plasma cytokine/chemokine profiling at baseline (pre-infusion), week 1 post-infusion no. 1, week 2 post-infusion no. 1, week 4 post-infusion no. 1 and disease progression. The disease progression time point was chosen based on sample availability closest in date to radiographic PD confirmation (regardless of whether the sample was collected before or after radiographic PD confirmation). a) Heatmap showing post-infusion IL-6 plasma concentration dynamics (yellow ≥500 pg/mL) for Arm A. b) Heatmap showing post-infusion IL-8 plasma concentration dynamics (yellow ≥500 pg/mL) for Arm A. c) Heatmap showing post-infusion IL-6 plasma concentration dynamics (yellow ≥500 pg/mL) for Arms B/C. d) Heatmap showing post-infusion IL-8 plasma concentration dynamics (yellow ≥500 pg/mL) for Arms B/C. e) Heatmap showing post-infusion CCL2 plasma concentration dynamics (yellow ≥500 pg/mL) for Arm A. f) Heatmap showing post-infusion CXCL10 plasma concentration dynamics (yellow ≥500 pg/mL) for Arm A. g) Heatmap showing post-infusion CCL2 plasma concentration dynamics (yellow ≥500 pg/mL) for Arms B/C. h) Heatmap showing post-infusion CXCL10 plasma concentration dynamics (yellow ≥500 pg/mL) for Arms B/C. *indicates patients that received infusion of a TAA-specific product.
Extended Data Fig. 4 Plasma Cytokine and Chemokine Pooled Analyses.
a-e) Patient plasma IL‑6, IL-8, and CCL2 concentrations reflected as log2 fold changes from Day 0 (pre‑infusion baseline). Violin plots depict distributions, with dashed horizontal lines indicating the median. One‑sample Wilcoxon signed‑rank tests (two‑tailed) were used to assess whether median log2 fold change at approximately day 7, 14, and 28 differed from 0. Asterisks represent statistical significance (*, p < 0.05; **, p < 0.01; ***, p < 0.001) with ns indicating no significance (p ≥ 0.05). (a) Arm A, IL‑6: median log2 fold change was 3.1 at Day 7 (n = 11; p = 0.024, W = 50, 95% CI: −1.013 to 10.64), 4.6 at Day 14 (n = 11; p = 0.0186, W = 52, 95% CI: −1.246 to 7.860), and 3.1 at Day 28 (n = 10; p = 0.0273, W = 43, 95% CI: −1.449 to 10.88). (b) Arm A, IL‑8: median log2 fold change was 5.4 at Day 7 (n = 11; p = 0.0068, W = 58, 95% CI − 0.5781 to 10.08), 6.2 at Day 14 (n = 11; p = 0.0068, W = 58, 95% CI − 0.5080 to 9.284), and 6.5 at Day 28 (n = 10; p = 0.0137, W = 47, 95% CI − 0.7446 to 10.34). (c) Arms B/C, IL‑6: median log2 fold change was 1.2 at Day 7 (n = 20; p = 0.0009, W = 168, 95% CI 0.3831 to 2.982), 2.1 at Day 14 (n = 20; p = 0.0006, W = 172, 95% CI 0.2600 to 5.009), and 1.3 at Day 28 (n = 19; p = 0.0010, W = 154, 95% CI − 0.003611 to 3.658). (d) Arms B/C, IL‑8: median log2 fold change was 3.2 at Day 7 (n = 20; p = 0.0001, W = 186, 95% CI 1.027 to 4.894), 4.3 at Day 14 (n = 20; p = 0.0003, W = 178, 95% CI 0.9175 to 7.867), and 4.0 at Day 28 (n = 20; p = 0.0010, W = 166, 95% CI − 0.06790 to 5.201). (e) Arms B/C, CCL2: median log2 fold change was 0.15 at Day 7 (n = 20; p = 0.12, W = 84, 95% CI − 0.06 to 0.40), 0.42 at Day 14 (n = 20; p = 0.0192, W = 124, 95% CI 0.1291 to 1.324), and −0.03 at Day 28 (n = 19; p > 0.999, W = 0, CI − 0.2273 to 0.3946). (f) Absolute IL‑6 (left-most), IL‑8 (middle left), CCL2 (middle right) and CXCL10 (right-most) concentrations are shown as summary statistics for all samples at Day 0 (baseline; n = 31) and Days 7 (n = 33), 14 (n = 33), and 28 (n = 31) post‑infusion. Y‑axes are shown on a log10 scale. The median across all participants at each time point is indicated by the solid dark gray line, with the 25th and 75th percentiles represented by the nonuniformly dashed and uniformly dashed lines, respectively. Participants who experienced SAEs at least possibly related to the TAA-T product are overlaid as individual data points at each time point for reference (P27, pink; P42, blue). Arrows indicate the timing of SAE onset.
Extended Data Fig. 5 Associations between plasma IL-6 and IL-8 concentrations and adverse events.
a-f) Maximum baseline-subtracted IL-6 and IL-8 concentration per patient from Days 7 to 28 by maximum AE grade (Grade 1, Grade 2, ≥Grade 3) were plotted, with the bar representing the median, and error bars the interquartile range. n = 31 total patients, with n = 11 patients with maximum AE grade of 1, n = 11 patients with maximum AE grade of 2, and n = 9 patients with a maximum AE grade of 3 + . Group differences were assessed by Kruskal-Wallis tests with Dunn’s post hoc multiple comparisons testing. Outliers were identified but were retained in the primary analyses shown here. (a) ΔIL-6max difference was observed among groups (p = 0.0157; Kruskal-Wallis statistic = 8.305), with a significant difference between patients with grade 1 versus grade 2 maximum AE severity (adjusted p = 0.0127; mean rank difference = −11.09; z = 2.86). (b) ΔIL-8max difference was observed among groups (p = 0.043; Kruskal-Wallis statistic = 6.293), with no significant differences between groups (based on adjusted p values). c-f) Asterisks represent statistical significance (*, p < 0.05; **, p < 0.01; ***, p < 0.001). c-d) Number of grade ≥2 TEAEs per patient during the post-infusion safety monitoring period, stratified by peak plasma IL-6 and IL-8 concentration through Week 4, and compared using a two-sided Mann–Whitney U-test. Each point represents an individual patient; the bar, the median; and error bars, the interquartile range. Outliers were identified (ROUT, Q = 1%) but were retained in the analyses shown here. (c) Patients with peak IL-6 ≥ 500 pg/mL (n = 6) experienced a higher number of grade ≥2 TEAEs than those with IL-6 < 500 pg/mL (n = 27; p = 0.0211, median 3.5 vs 1.0, Hodges–Lehmann median difference = 3.0, 95.47% CI of difference: 0.00 to 13.00). (d) Patients with peak IL-8 ≥ 500 pg/mL (n = 16) experienced a higher number of grade ≥2 TEAEs than those with IL-8 < 500 pg/mL (n = 17; p = 0.0036, median 2.5 vs 0.0; Hodges–Lehmann median difference = 1.5, 95.13% CI of difference: 1.00 to 4.00). e-f) Baseline-subtracted maximum IL-6 and IL-8 concentrations (pg/mL) from Day 7 to Day 28 are shown for each patient, in patients who did (+) or did not (-) experience a MP rash during the safety monitoring period, using a two-sided Mann- Whitney U-test. Each point represents an individual patient; the bar, the median; and error bars, the interquartile range. Outliers were identified (ROUT, Q = 1%) but were retained in the primary analyses shown here. (e) Maximum ΔIL-6 in participants without versus with rash (n = 26 vs. 5, p = 0.0007, Hodges–Lehmann estimate of median difference −567.9, U = 8, 95.24% CI of difference: −2957 to −383.4). (f) Maximum ΔIL-8 in participants without versus with rash (n = 26 vs. 5, p = 0.0023, Hodges–Lehmann estimate of median difference −6787, U = 12, 95.24% CI of difference: −8672 to −704.8).
Supplementary information
Supplementary Information (download PDF )
Supplementary Figs. 1–6, Tables 1 and 2, and the ReMIND Trial protocol.
Supplementary Data 1 (download XLSX )
Statistical source data for Supplementary Figures.
Source data
Source Data Figs. 1–4, and Extended Data Figs. 1 and 3–5 (download XLSX )
Statistical source data for Figs. 1–4, and Extended Data Figs. 1 and 3–5.
Rights and permissions
Open Access This article is licensed under a Creative Commons Attribution-NonCommercial-NoDerivatives 4.0 International License, which permits any non-commercial use, sharing, distribution and reproduction in any medium or format, as long as you give appropriate credit to the original author(s) and the source, provide a link to the Creative Commons licence, and indicate if you modified the licensed material. You do not have permission under this licence to share adapted material derived from this article or parts of it. The images or other third party material in this article are included in the article’s Creative Commons licence, unless indicated otherwise in a credit line to the material. If material is not included in the article’s Creative Commons licence and your intended use is not permitted by statutory regulation or exceeds the permitted use, you will need to obtain permission directly from the copyright holder. To view a copy of this licence, visit http://creativecommons.org/licenses/by-nc-nd/4.0/
About this article
Cite this article
Gomez, S., DiCioccio, R.A., Geiger, A.E. et al. Multi-antigen-targeting T cells in pediatric central nervous system tumors: a phase 1 trial. Nat Med (2026). https://doi.org/10.1038/s41591-026-04449-9
Received:
Accepted:
Published:
Version of record:
DOI: https://doi.org/10.1038/s41591-026-04449-9