The benefits of diversifying across asset classes as a risk‑management tool are widely accepted, but what’s easily overlooked is that the relative benefits wax and wane over time. That doesn’t invalidate global asset allocation, but it does serve as a reminder that your mileage will vary.
There are several ways to measure asset allocation’s value for portfolio design and management. A useful first step is tracking how return correlations vary through time. In contrast with the popular approach of looking at a single snapshot and calling it a day, reviewing rolling numbers offers a more realistic profile of the dynamic nature of correlations, which in turn helps manage expectations for how global asset allocation will perform.
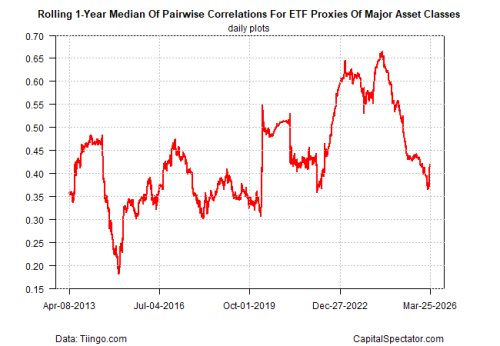
Let’s start with a top‑down review of the median correlation for all major asset classes using a rolling 1‑year window of daily data. The current reading is 0.42 (see chart below). As a recap, correlations range from –1.0 (perfect negative correlation) to +1.0 (perfect positive correlation). The latest value indicates a moderately low degree of positive correlation, which has fallen substantially from above 0.65 a few years ago. In other words, the implied benefits of diversification across major asset classes have strengthened. One could say that investors are getting more bang for the asset‑allocation buck lately.
Keep in mind that a range of correlations is the basis for holding multiple asset classes. If everything was perfectly correlated, there would be no point in holding more than one asset.
Back in the real world, the next chart focuses on how correlations have changed from the viewpoint of a US stock fund—in this case, Vanguard’s Total Stock Market ETF (VTI). The three lines compare VTI with equities in developed markets ex‑U.S. (VEA), emerging markets (VWO), and U.S. bonds (BND).
Drilling down further, the table below summarizes how correlations stack up over the trailing 5‑year window for all major asset classes. At the extremes, the results range from 0.02 for commodities (DJP) and U.S. bonds (BND) to 0.85 for government bonds in developed markets ex‑U.S. (BWX) and global corporate bonds ex‑US (PICB).
This type of analysis is just one piece of the puzzle, of course. A real-world plan might also consider expected returns for asset classes. Even more important: customizing the portfolio for the investor or institution to factor in the specific time horizon, risk tolerance, etc.
Correlations are a useful first step in designing a portfolio strategy, highlighting what’s available for risk management. Although the numbers will change, the concept of global asset allocation endures. Because the future is always unknowable, investing across asset classes is consistently beneficial. What isn’t fixed is the degree of the benefits on offer in any given period.
Learn To Use R For Portfolio Analysis
Quantitative Investment Portfolio Analytics In R:
An Introduction To R For Modeling Portfolio Risk and Return
By James Picerno
Facts Only
Diversification across asset classes is a widely accepted risk-management tool.
The effectiveness of diversification varies over time.
Tracking rolling correlations provides a dynamic view of asset class relationships.
The current median correlation for major asset classes is 0.42, indicating moderate positive correlation.
This correlation has decreased from above 0.65 a few years ago.
Correlations range from -1.0 (perfect negative) to +1.0 (perfect positive).
A correlation of 0.42 suggests stronger diversification benefits than higher values.
Perfect correlation would eliminate the need for holding multiple assets.
Correlations between U.S. stocks (VTI) and other assets (VEA, VWO, BND) are analyzed.
Over five years, correlations range from 0.02 (commodities vs. U.S. bonds) to 0.85 (certain global bond classes).
Portfolio design should also consider expected returns and investor-specific factors.
Global asset allocation remains beneficial despite fluctuating correlation levels.
Executive Summary
Full Take
The narrative presents a robust case for global asset allocation, emphasizing its dynamic nature rather than static assumptions. The strongest version of this argument acknowledges that while diversification’s benefits ebb and flow, the principle itself endures as a hedge against uncertainty. The analysis avoids emotional exploitation or distortion, focusing on empirical data—rolling correlations, specific asset class comparisons—to ground its claims. It resists oversimplification by noting that correlations are just one piece of portfolio design, alongside expected returns and investor-specific needs.
Patterns detected: none
Root cause: The underlying paradigm assumes markets are inherently unpredictable, making diversification a rational response to uncertainty. The unstated assumption is that investors can tolerate short-term volatility for long-term stability, a perspective rooted in modern portfolio theory. Historically, this echoes the post-2008 shift toward more sophisticated risk management, where static models proved inadequate.
Implications: For human agency, this framework empowers investors to act despite uncertainty, but it also demands continuous monitoring and adaptation. The beneficiaries are those with access to diversified portfolios and analytical tools, while costs may fall on less sophisticated investors who misinterpret correlation shifts as guarantees. Second-order consequences include potential over-reliance on historical data, which may not predict future crises.
Bridge questions: How might behavioral biases (e.g., recency bias) distort interpretations of correlation trends? What role do structural market changes (e.g., globalization, monetary policy) play in altering asset class relationships? Would the benefits of diversification hold in a systemic crisis where correlations converge?
Counterstrike scan: A coordinated influence campaign might exaggerate diversification’s reliability or downplay its limitations to sell financial products. The actual content avoids this, presenting correlations as one tool among many and explicitly noting their variability. No structural alignment with manipulative tactics is detected.
Sentinel — Human
This article is likely human-written, demonstrating a balanced and coherent argument about portfolio analysis and global asset allocation. However, the analysis is probabilistic and based on the style, structure, and content of the text, not the claims made within.