Katherine Broner
Reva Ranka
Cloud cost data is most useful when teams can adapt it to their own reporting and planning needs. In addition to viewing cost breakdowns, FinOps teams often need to calculate forecasts, reshape datasets, and present tailored views to finance and leadership teams. In many workflows, those steps happen outside the observability platform. Once the data is exported, it quickly becomes outdated and requires repeated manual updates.
Datadog Sheets addresses this issue in combination with Datadog Cloud Cost Management (CCM). With Sheets, you can analyze CCM cost data across providers, services, and teams by using structured tables that support calculated columns and pivot tables. Sheets also offers flexible spreadsheet-style tabs (in Preview), where you can write formulas, reference table data, and design custom layouts while staying connected to live Datadog data.
In this post, we’ll show examples of how you can use Sheets and CCM to:
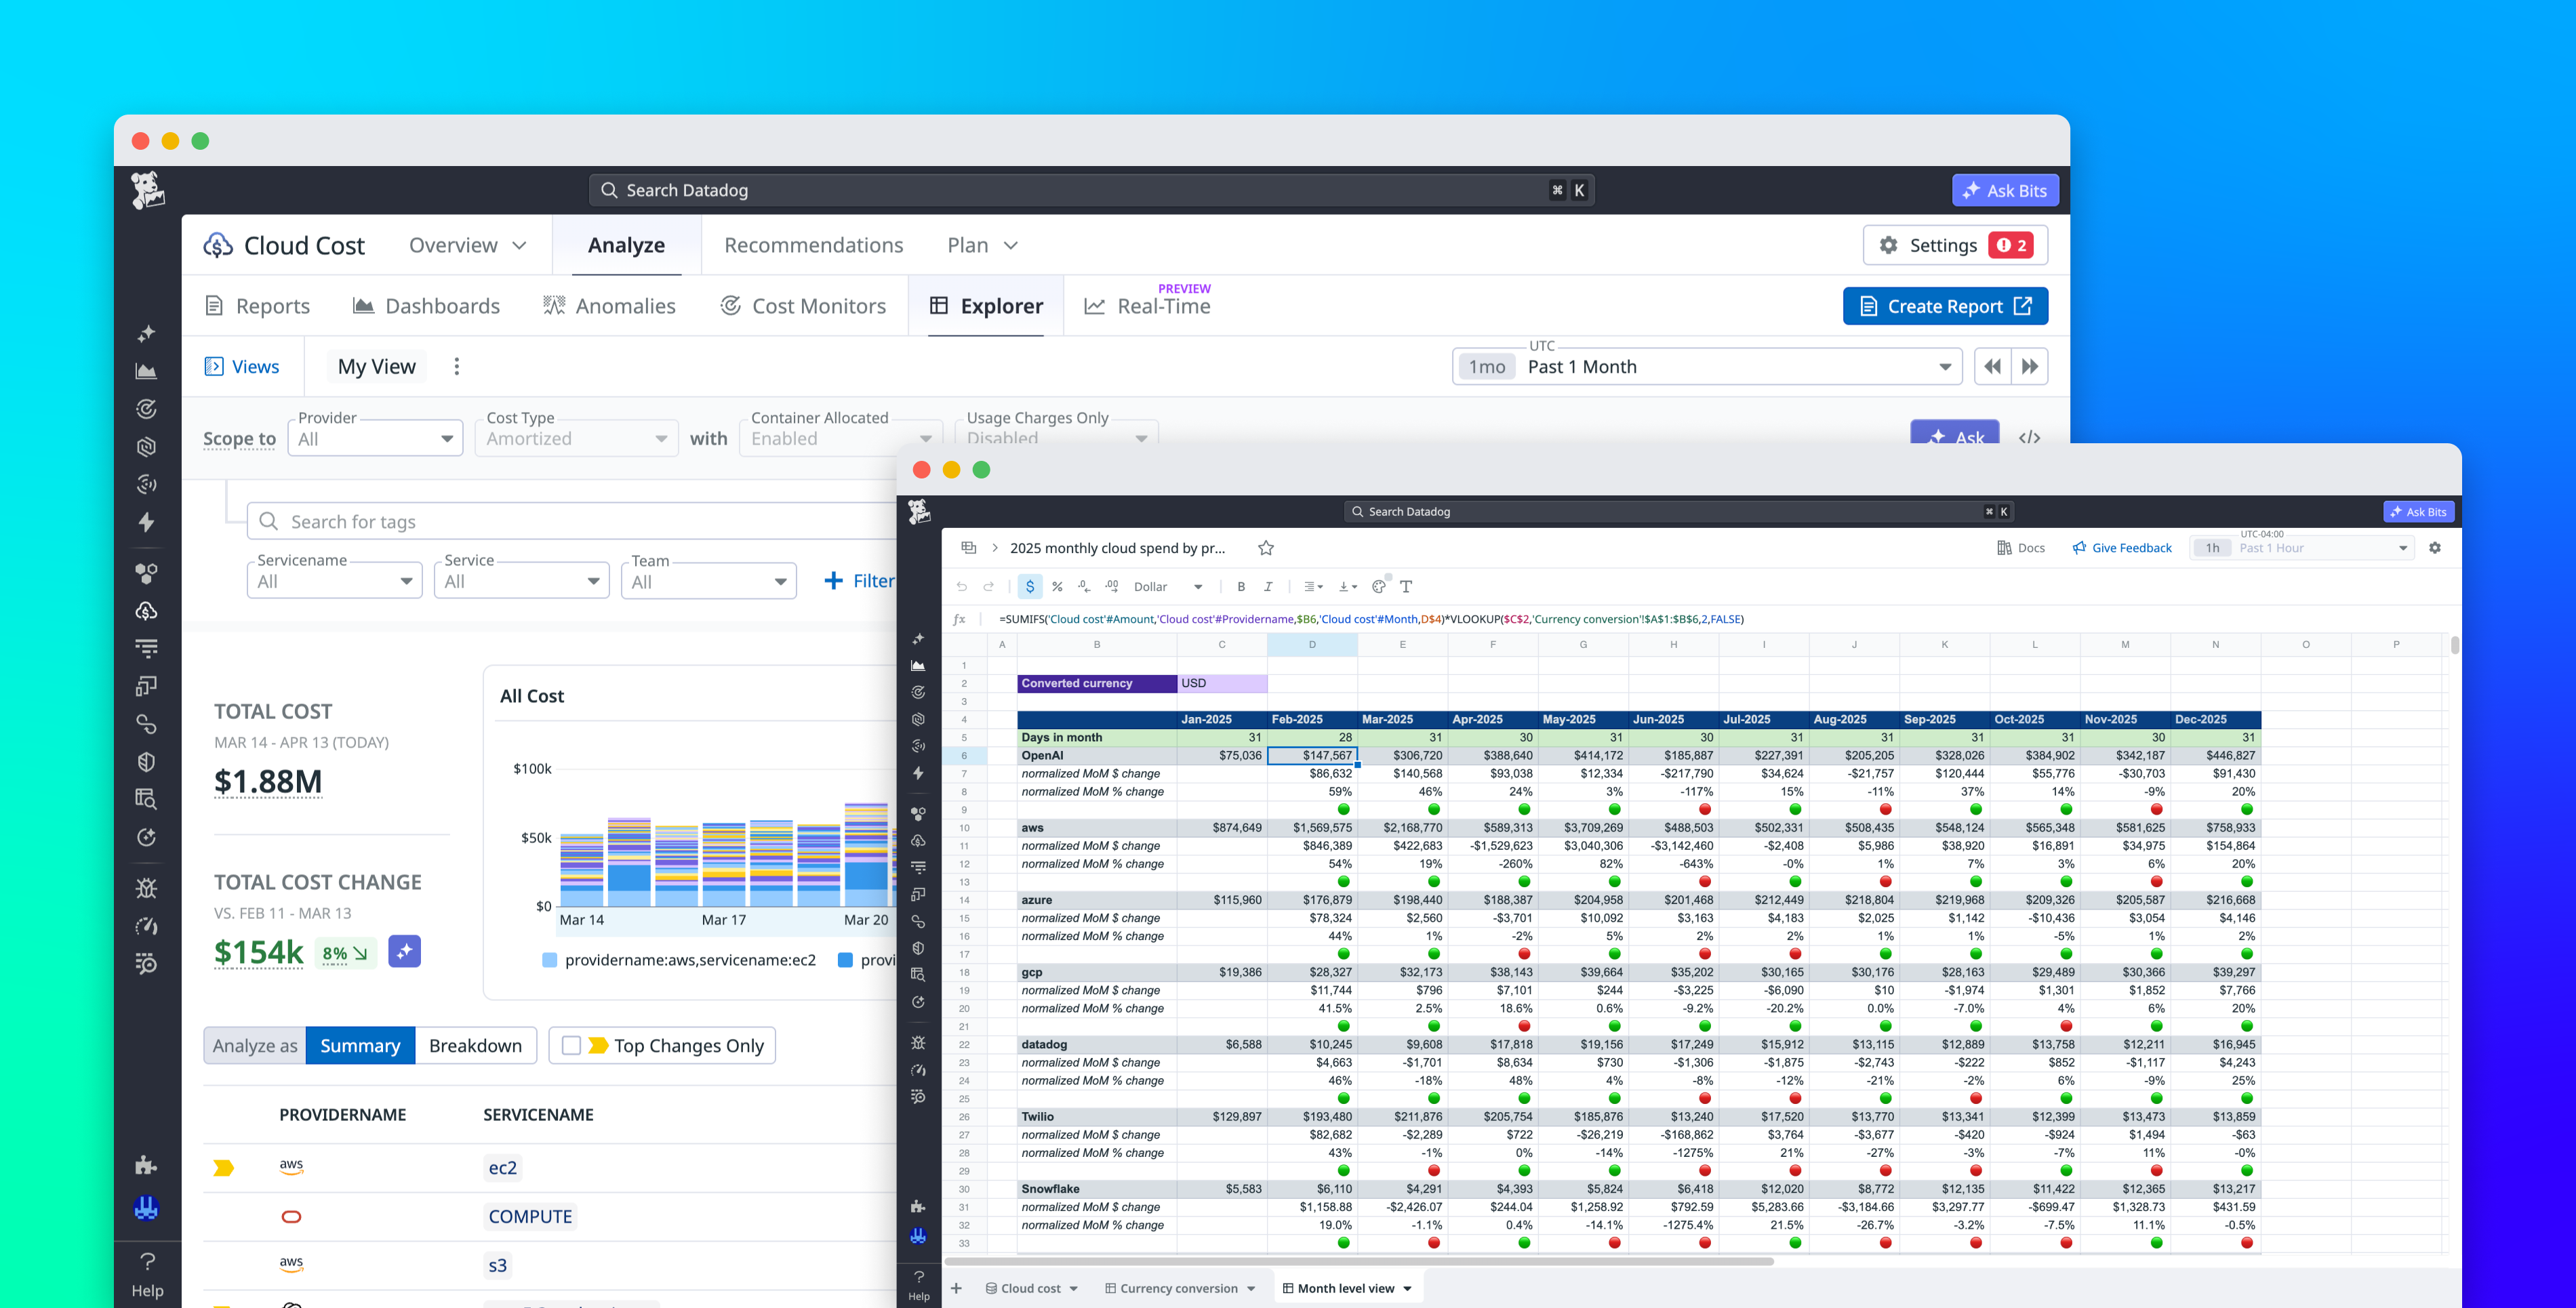
Track monthly cloud spend by provider
FinOps reporting often requires combining raw cost data with business-specific transformations, such as currency conversion. These requirements frequently go beyond static tables or dashboards, especially when different stakeholders need different views of the same data.
For example, let’s say that you’re an SRE or a FinOps analyst who is responsible for reporting monthly cloud spend across providers such as AWS, Microsoft Azure, and Google Cloud. Your finance team in EMEA needs costs in euros, and your leadership team wants a clear monthly summary of spend, grouped by provider.
You can start by creating a table in Datadog Sheets that pulls daily cloud cost by provider and service directly from CCM. The CCM-backed table gives you a continuously updated dataset that reflects the latest spend across all providers.
Next, you can create a separate sheet tab to handle currency conversion. For example, you might maintain a small table of exchange rates and use spreadsheet formulas to convert your model from USD to EUR. When exchange rates change, you can update every converted cost in the sheet by changing the value of a single cell.
In another tab, you can aggregate daily costs into a monthly report. Using spreadsheet formulas such as VLOOKUP
and SUMIF
, you can calculate totals by provider, track month-over-month changes, and organize the data into a format suitable for leadership. Because each step references the original CCM-backed table, the report updates automatically as new cost data arrives.
Forecast yearly cloud spend by team
Budget planning requires combining historical cost data with projections, growth assumptions, and planned changes to infrastructure. These workflows often involve layering business context on top of raw cost data so that teams can plan ahead with confidence.
If you’re planning next year’s cloud budget, you need to estimate how much each team will spend based on current usage, expected growth, and upcoming initiatives. You can begin by creating a table that pulls monthly amortized AWS costs attributed to each team. CCM maps costs to teams based on your infrastructure and resource usage, giving you a reliable baseline for planning.
From there, you can build a forecast in a spreadsheet tab. You might apply different growth rates for each team, account for planned migrations, and define budget targets. Spreadsheet formulas make it possible to adjust assumptions and immediately see how projections change.
As the year progresses, actual costs flow into your CCM table. Because your forecast references that live table, you can compare projected spend against real spend without updating or re-importing data. For example, when January costs arrive, your sheet can immediately show how actual spend compares to your forecast.
Build connected cost analysis workflows in Datadog
Flexible spreadsheet tabs in Datadog Sheets extend CCM by giving teams a place to perform custom analysis alongside live cost data. You can calculate forecasts, apply business logic, and build reports without exporting data or recreating workflows in external tools. To get started, join the Preview for flexible spreadsheets. You’ll get access to a templates gallery of prebuilt spreadsheets for common cloud cost use cases, including the ones covered in this post, that you can customize and reuse.
To learn more about Sheets and CCM, explore the Sheets documentation and the CCM documentation.
If you’re new to Datadog, you can sign up for a 14-day free trial to start analyzing your cloud costs.
Facts Only
* Cloud cost data is most useful when teams can adapt it to their own reporting and planning needs.
* Datadog Sheets addresses the need for workflow adaptation in combination with Datadog Cloud Cost Management (CCM).
* Sheets allows analysis of CCM cost data across providers, services, and teams using structured tables, calculated columns, and pivot tables.
* Users can perform business-specific transformations, such as currency conversion, using spreadsheet formulas.
* Daily cloud costs by provider and service can be pulled directly from CCM into a Datadog Sheets table.
* Daily costs can be aggregated into monthly reports using spreadsheet formulas like VLOOKUP and SUMIF.
* Forecasts can be built by combining historical cost data with growth assumptions for each team.
* Actual costs flow into the CCM table, allowing for comparison against forecasts in the spreadsheet.
* Flexible spreadsheet tabs extend CCM by allowing custom calculation and reporting.
Executive Summary
Full Take
The narrative positions flexible spreadsheet tools as a necessary bridge between raw operational cost data and strategic financial planning, arguing that specialized observability platforms are insufficient for the complex, contextualized needs of FinOps. This pattern appeals to the desire for data democratization, suggesting that complex analysis should be accessible through familiar tools, thereby shifting the locus of critical decision-making to the reporting layer. The system of connecting live cost data (CCM) with flexible calculation environments (Sheets) and projection models (forecasts) suggests a pattern of minimizing friction in the reporting chain, making the transition from cost tracking to budget planning feel seamlessly integrated.
However, the emphasis on Sheets facilitates the handling of business logic (like currency conversion or growth rates) externally, which introduces a potential abstraction layer between the source data and the derived insights. This raises the question of whether this method genuinely empowers teams with greater control or simply externalizes the complexity of necessary transformations, potentially obscuring the inherent limitations or necessary assumptions within the data modeling itself. The implication is a move toward decentralized cost accountability, but it requires careful scrutiny of whether this efficiency gain does not lead to an unexamined reliance on spreadsheet formulas for critical financial integrity, potentially overlooking the risks associated with automated or manual data transformations.
Patterns detected: ARC-0043 Motte-and-Bailey, ARC-0024 Ambiguity
Sentinel — Human
The text is highly coherent and instructionally structured, exhibiting patterns often found in expertly crafted online tutorials, but lacks the idiosyncratic variation of a typical human journalistic voice.