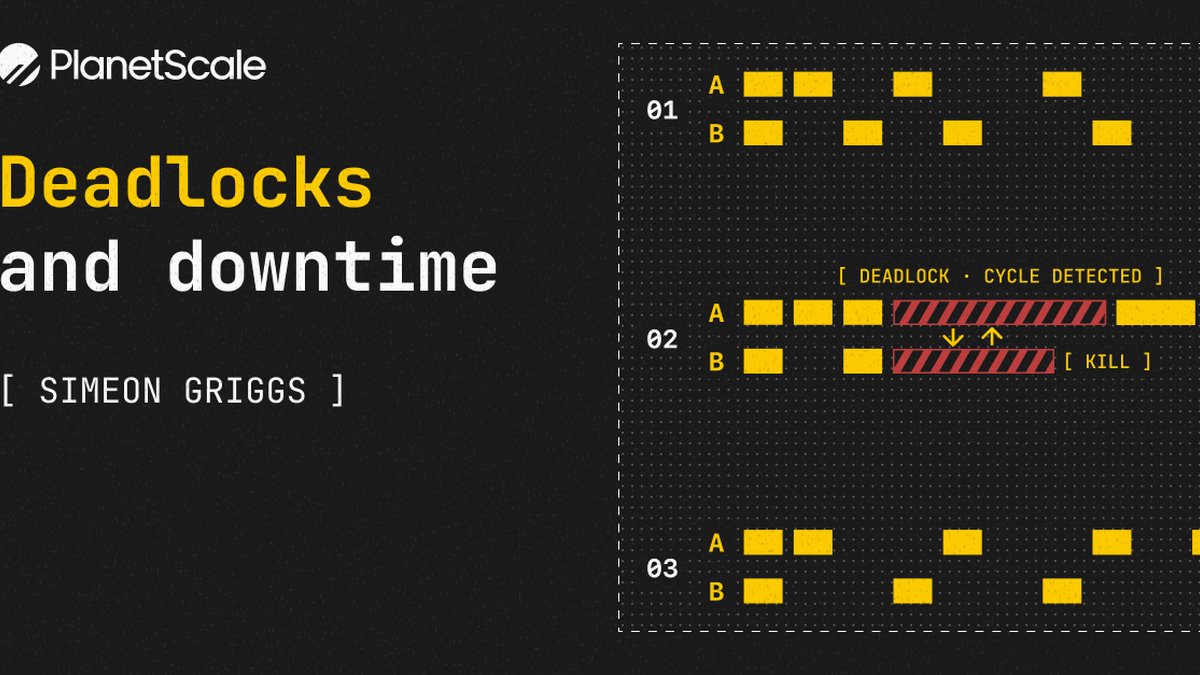
Every second* of every day, your Postgres database could be hunting with intent to kill.
*or whatever your deadlock_timeout
setting is.
Deadlocks happen when multiple transactions each hold a lock that the other needs, blocking both from proceeding. When a transaction has been waiting on a lock for longer than deadlock_timeout
, Postgres runs its deadlock detector. If it finds a cycle, it cancels one transaction in the cycle — freeing the others to proceed.
Without this process, new transactions could continue to queue up behind the deadlock until the connection pool is full and the database is overwhelmed.
Your database stays healthy as long as deadlock scenarios are infrequent and small. But if your application is creating these events faster than your database can kill them, it won't be enough to keep up.
How deadlocks occur
There are several ways a Postgres transaction will acquire a lock on a row.
The simplest representation is two separate, concurrent transactions that attempt to update the same rows in a different order.
Transaction A is stuck waiting for row 2 to become available. Transaction B is stuck waiting for row 1.
The damage deadlocks do
A single deadlock won't bring down your database. A high frequency of deadlocked transactions can.
Backed up transactions
While transactions A and B wait for one another, transactions C, D, E, and so on may also be stuck if they need the same locks. The default deadlock_timeout
of one second means transactions wait at least that long before the detector even runs.
Every second counts. If your database is receiving a high volume of queries per second (QPS), a large and problematic queue can form quickly.
Retry storms
This is made worse if your application resubmits the same query immediately and repeatedly with retry logic. Whenever your database kills transactions, your application immediately retries, recreating the deadlock scenario in an endless cycle.
Send, locked, killed, error, retry, locked, killed, error...
Reducing deadlock likelihood in queries
In the visual shown earlier, two transactions attempt updates to the same rows in the opposite order.
- Transaction A updates row 1 and then row 2
- Transaction B updates row 2 and then row 1
Where possible, process transactions in a consistent order. These two may still briefly block one another, but they should not deadlock as long as they make their updates in the same order.
Keep transactions short
The fewer rows a single transaction needs to lock, the better. Where possible, split transactions into smaller atoms of work and lock rows as late as possible within each one.
How latency leads to deadlocks
Deadlock errors are often a lagging indicator of an issue. The problem is sometimes first revealed as database latency.
Any transaction that was held up due to a deadlock and then allowed to proceed because the other transaction was killed would have a slower overall execution time than it should have.
Lower latency, fewer chances to deadlock.
See how the same transaction is fast until deadlocked. Canceling one of the deadlocked transactions allows the other to complete, but not as quickly as it should have.
Queries that run frequently but show abnormally high or inconsistent execution times relative to their size could signal a future problem.
Slow queries often result from missing indexes. Even a small query that must perform a full sequential scan (seq scan) every time increases latency.
Shorter transactions reduce the window for conflicts, making deadlocks less likely, though lock ordering still matters a ton.
Reducing deadlock frequency from your app
In the event of a deadlock, you will receive a response back from your database with the 40P01
error code (Postgres's SQLSTATE for "deadlock detected"). Your application should check for that and act accordingly.
Your application should have built-in retry logic with backoff (increasing wait times between attempts) and jitter (a random delay added to each retry).
You do not want your app to resubmit the same transaction immediately, nor at a consistent cadence.
With backoff, if the transaction fails more than once, each retry should wait longer than the last, giving existing, competing transactions time to complete.
Jitter refers to an additional amount of random time added to the backoff so that your application is not consistently spamming attempts at the exact same time.
Observing errors
Your application should catch and handle errors, but even if it doesn't, they will be surfaced to you in the PlanetScale dashboard.
The errors tab under Insights shows all errors and the queries responsible for them. From here, you'll see the "40P01: Deadlock detected" errors.
Protecting your database with Traffic Control
While you can decrease the likelihood of deadlocks through better defensive programming in your queries and applications, Traffic Control gives you extra built-in protection at the database level.
After seeing which queries are causing deadlocks, you can create a Resource Budget to reduce the amount of database resources that queries can consume.
Note
While you can create a query-specific Resource Budget, we recommend targeting by query tags instead, which lets you group related queries by label rather than matching exact SQL.
Since overlapping executions are the key problem, set a budget for a problematic query with only a very small capacity of concurrent workers.
This can help mitigate deadlock scenarios, as Traffic Control can reject matching queries before they consume too much configured concurrency or resource budget.
You can set Resource Budgets to "warning" mode first to observe the impact on your application and the frequency of queries it catches, then switch to "enforce" mode to begin blocking matching queries before they execute and acquire new locks.
Conclusion
Your database's deadlock detection works exactly as designed: it finds cycles and breaks them. The question is whether your application lets that be the end of it, or immediately recreates the problem.
Improve your queries, implement retry logic, and use Traffic Control to protect your database from deadlocks and downtime.
Sentinel — Human
This text reads like high-quality, technically informed advice distilled from real-world database performance troubleshooting, focusing on practical application mitigations rather than abstract theory.