Abstract
Immune checkpoint inhibitors (ICIs) are a standard treatment across cancers, yet most patients do not respond, and existing biomarkers generalize poorly across tumor types and therapies. Here we present COMPASS, a pan-cancer foundation model that predicts immunotherapy response from bulk tumor transcriptomes using a concept bottleneck transformer. COMPASS encodes gene expression through 44 biologically grounded immune concepts representing immune cell states, tumor−microenvironment interaction and signaling pathways. Trained on 10,184 tumors across 33 cancer types, COMPASS achieves better average performance than 22 methods across 16 clinical cohorts spanning seven cancers and six ICIs, improving accuracy by 8.5% and area under the precision-recall curve by 15.7% on average across cohorts. COMPASS generalizes to cancer types and treatments not represented during fine-tuning and may inform indication selection and patient stratification. In survival analyses, patients classified by COMPASS as responders had longer overall survival (hazard ratio = 4.7, P < 0.0001). Personalized response maps connect gene expression to immune concepts, identifying programs associated with response and resistance; in immune-inflamed non-responders, COMPASS highlights programs including TGFβ signaling, endothelial exclusion, CD4+ T cell dysfunction and B cell deficiency. COMPASS predicts immunotherapy response and provides hypothesis-generating mechanistic insight for trial design and translational studies.
Main
ICIs have transformed cancer treatment, but clinical benefit remains uneven across tumor types, and only a minority of patients achieve durable responses1. Although tumor mutational burden (TMB) and programmed death ligand 1 (PD-L1) expression represent clinically validated predictive biomarkers, their limited accuracy restricts reliable patient selection2. Responses range from durable remission to primary resistance, reflecting differences in tumor–immune interactions. In solid tumors, ICI responders typically exhibit an immune-inflamed phenotype, marked by CD8+ T cell infiltration. Non-response is often associated with immune-desert or immune-excluded phenotypes3. A substantial subset of non-responders nevertheless maintains immune-inflamed characteristics, highlighting the biological complexity of resistance mechanisms. Improving prediction of ICI response and identifying mechanisms of response and resistance are essential for guiding personalized treatment and improving patient outcomes4.
Biomarkers, including TMB, PD-L1 immunohistochemistry (IHC) score, CD8+ T cell infiltration and immune gene expression signatures, provide incomplete insights into ICI response mechanisms5. High TMB correlates with clinical benefit to ICI in some cancers, likely as a surrogate for increased neoantigen presentation6, but fails to fully predict response: many high-TMB tumors remain refractory, whereas some low-TMB tumors respond robustly. Transcriptomic signatures, such as TIDE (T cell dysfunction)7 and IMPRES (immune checkpoint activity)8, offer mechanistic insight but show variable predictive performance across cancer types9,10,11. A pan-cancer analysis of 27,810 ICI-treated patients further underscores these limitations, revealing weak or inconsistent associations among PD-L1, CD8+ T cells, immune gene scores and TMB with response across tumors12. Transcriptome-based machine learning models use gene expression and related omics signals to predict treatment response. ENLIGHT models response using transcriptome-derived gene interactions13,14,15. EaSIeR predicts response from interpretable immune and microenvironmental gene programs16. Graph-based approaches represent molecular dependencies as graphs and learn predictors over these structures17. Although valuable, many methods remain cancer type specific or rely on fixed interaction maps and predefined gene signature scores.
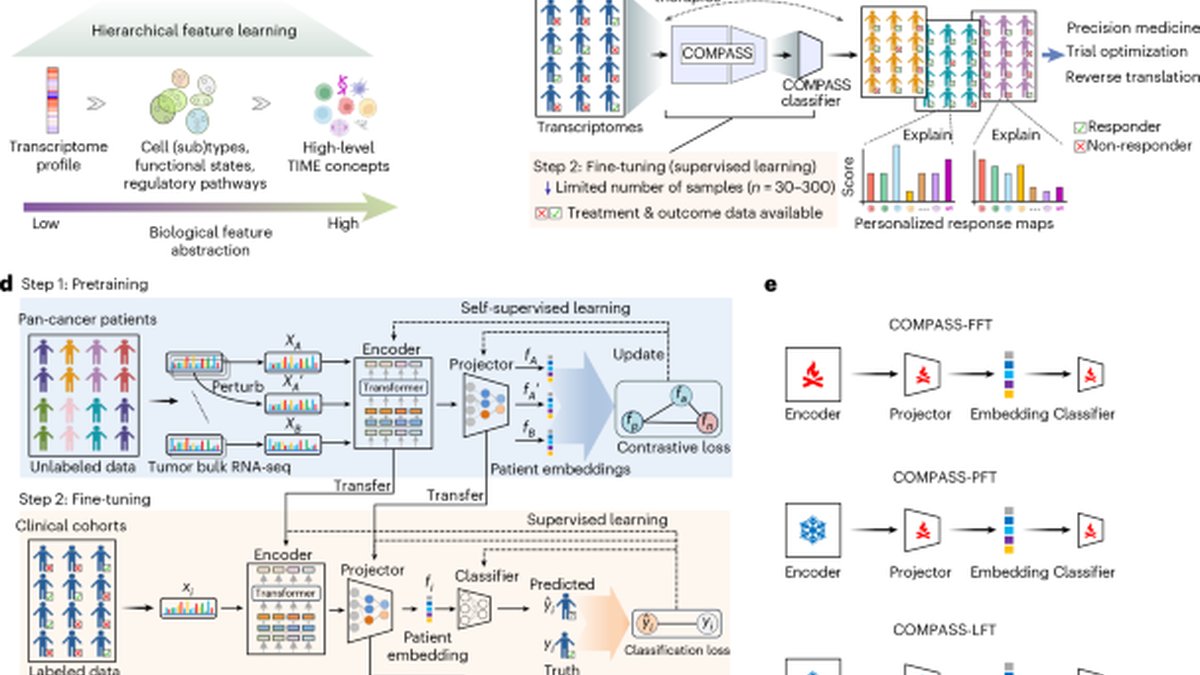
We developed COMPASS, a pan-cancer foundation model that learns interpretable tumor-immune concepts from transcriptomic data. COMPASS uses a concept bottleneck architecture18 that routes a patient’s transcriptome through human-readable concepts. In retinal imaging, for example, such models can first predict tissue and lesion maps and then use these intermediate outputs for diagnostic triage. We introduce this approach in cancer transcriptomics by defining tumor-immune concepts, pretraining with self-supervised contrastive learning on pan-cancer RNA sequencing (RNA-seq) and transferring to small clinical cohorts with parameter-efficient fine-tuning. COMPASS maps bulk RNA-seq profiles to biologically grounded concepts spanning immune cell states, tumor−microenvironment interactions and signaling pathways (Fig. 1a). It pretrains on transcriptomes from 33 cancer types and fine-tunes on clinical cohorts to predict response to ICIs, including anti-PD-1/programmed death ligand 1 (PD-L1), anti-cytotoxic T-lymphocyte-associated protein 4 (CTLA-4) and combination therapies (Fig. 1b,c).
We evaluate COMPASS on 1,133 patients from 16 clinical cohorts spanning seven cancer types, using pretreatment tumor RNA-seq profiles to predict response to ICIs. In leave-one-cohort-out evaluation, COMPASS achieves the best average performance among 22 models, improving accuracy by 8.5% and area under the precision-recall curve (AUPRC) by 15.7%. Across settings, COMPASS generalizes to new cohorts, cancer types and treatments and supports parameter-efficient transfer to small clinical cohorts. In a held-out phase 2 trial of metastatic urothelial carcinoma, patients predicted as responders by COMPASS show significantly longer survival (hazard ratio = 4.7, P = 1.7 × 10⁻⁷), outperforming TMB and PD-L1 IHC biomarkers.
COMPASS generates personalized response maps that connect gene expression to immune concepts and provides mechanistic interpretation of treatment response for individual patients. The maps highlight key drivers (T cell exhaustion, myeloid programs and immunoregulatory signaling) and resolve cases where canonical immune phenotypes (inflamed, excluded and desert) are misleading. For example, inflamed non-responders exhibit TGFβ-driven suppression, vascular exclusion or CD4+/B cell dysfunction, whereas non-inflamed responders display residual cytotoxic activity or TMB-associated pathways without immunosuppressive signals. These results show that COMPASS identifies functional immune states that complement the coarse stratification provided by PD-L1 expression, TMB or bulk immune phenotypes. By combining transcriptomic data with tumor-immune modeling, COMPASS achieves cross-cancer and cross-therapy prediction and yields mechanistic insight into determinants of treatment response.
Results
COMPASS concept bottleneck transformer for immunotherapy response prediction
Predicting response to immunotherapy remains challenging because cohorts are small, patients are heterogeneous and tumor–immune interactions are complex. To address this, we developed COMPASS, a concept bottleneck model that combines pan-cancer pretraining on bulk tumor transcriptomes with a biologically structured architecture grounded in immune and stromal concepts (Fig. 1a). This design improves generalizability and enables parameter-efficient, interpretable adaptation to clinical settings.
To ground the model in biological features, we curated 132 gene signatures from the literature (Supplementary Data 1). The signatures capture immune cell types, functional states, pathways and non-immune tumor biology (for example, stromal programs and DNA damage response), which define COMPASSʼs interpretable representation of tumor-immune dynamics.
COMPASS uses a transformer-based gene language model to encode expression profiles of 15,672 protein-coding genes (Fig. 1d and Methods). It projects gene embeddings onto 132 gene signatures, which are then aggregated into 43 high-level tumor immune microenvironment (TIME) concepts using a hierarchical projector. A cancer type token is included as an additional concept. This process generates 44-dimensional patient embeddings that reflect patient-specific transcriptional programs.
We pretrained COMPASS on transcriptomes from 10,184 tumors in The Cancer Genome Atlas (TCGA) using self-supervised contrastive learning (Methods). Contrastive learning pulls perturbed (augmented) views of the same tumor together and pushes different tumors apart in the 44-dimensional concept space (Fig. 1d). This approach allows the model to learn patient representations of TIME. After pretraining, COMPASS is fine-tuned on clinical cohorts to predict immunotherapy response (Methods), using the concept representation of a patient as input and producing a response probability, with parameter-efficient updates depending on cohort size (Fig. 1d,e): full fine-tuning for large cohorts, partial updates for medium cohorts and adaptor-only training for small cohorts; when outcomes are unavailable, COMPASS supports zero-shot prediction via patient retrieval from the concept space (Supplementary Fig. 1).
COMPASS achieves state-of-the-art performance across 16 immunotherapy cohorts
We consider pretreatment bulk RNA-seq and clinical outcomes for 1,133 patients from 16 clinical cohorts (Fig. 2a, Extended Data Table 1 and Supplementary Table 1). These cohorts span seven cancer types and multiple ICI regimens (anti-PD-1/PD-L1, anti-CTLA-4 and combinations), with cohort sizes ranging from 16 to 298 patients. Patients are classified as responders (n = 346, 30.5%; complete or partial remission) or non-responders (n = 787, 69.5%; progressive or stable disease) (Methods). This dataset captures heterogeneity across indications, treatments, platforms and study designs.
To benchmark predictive performance, we compared COMPASS against 22 widely used ICI response prediction methods, spanning single-gene predictors, immune signature scoring approaches and network/machine learning models (Supplementary Table 2). We used a leave-one-cohort-out evaluation strategy to assess generalizability in clinically relevant scenarios (Fig. 2b). Models were trained on all but one cohort and evaluated on the held-out cohort. We evaluated performance using accuracy, AUPRC, area under the receiver operating characteristic (ROC) curve and Matthews correlation coefficient (MCC) (Methods).
COMPASS substantially improved upon ICI response prediction methods across all cohort sizes and metrics (Fig. 2c,d, Supplementary Fig. 2 and Supplementary Table 3). Partial fine-tuning (COMPASS-PFT) and linear probing (COMPASS-LFT) consistently delivered the highest overall predictive performance. Compared to the second-best-performing models, COMPASS-PFT and COMPASS-LFT improved accuracy by an average of 8.5%, AUPRC by 15.7% and MCC by 12.3%, demonstrating their superior capability for response prediction. Performance remained robust across large, medium and small cohorts, with COMPASS-PFT and COMPASS-LFT showing consistently strong results across settings (Fig. 2c,d).
Among the fine-tuning strategies evaluated, COMPASS-PFT and COMPASS-LFT provided the best balance between model adaptability and stability. By contrast, full fine-tuning (COMPASS-FFT), which updates all model parameters during training, performed worse when large cohorts were held out during leave-one-cohort-out evaluation, likely due to overfitting.
COMPASS generalizes within and across immunotherapy cohorts
We next assessed how accurately COMPASS predicts immunotherapy responses when training data are limited to a single cohort. We used two benchmarking strategies: intra-cohort leave-one-patient-out validation and cohort-to-cohort transfer across studies.
In intra-cohort validation, COMPASS achieved the best average performance across cohorts (Supplementary Figs. 3–6), although performance varied by setting, and existing methods outperformed COMPASS in some cohorts and precision-recall comparisons. COMPASS-PFT, COMPASS-LFT and COMPASS-FFT achieved the highest accuracy on medium and large cohorts. For small cohorts (fewer than 30 patients), the no-fine-tuning variant (COMPASS-NFT) performed best (Supplementary Fig. 3b). This likely reflects limited data, where additional fine-tuning can overfit and COMPASS-NFT leverages the pretrained concept space. Among previously published approaches, NetBio performed best on medium and large cohorts. For small cohorts, PGM, Texh and TIDE demonstrated better accuracy.
In the cohort-to-cohort transfer analyses, models trained on one cohort were used to predict responses in a different cohort, resulting in 240 pairwise transfer evaluations (16 cohorts × 15 possible transfers per cohort; Fig. 2e,f and Supplementary Figs. 7 and 8). We defined successful transfer as achieving a prediction accuracy greater than the reference accuracy for the target cohort (Methods). COMPASS-LFT performed best, with successful model transfer in 163 of 240 cases, followed closely by COMPASS-PFT with 155 successful model transfers. These results substantially exceeded the top-performing previously published methods, including PGM (130/240), Teff (118/240) and NetBio (117/240), with aggregated prediction accuracy and AUPRC shown in Fig. 2g,h. The strong performance of COMPASS-LFT, which updates only the final classification layer, suggests improved robustness under limited training data.
COMPASS predicts treatment response across cancer types, treatments and drug targets
To be clinically useful, predictive models must generalize beyond individual studies across cancer types, treatment regimens and immune checkpoint targets despite biological and technical heterogeneity19,20. We evaluated model generalizability along these clinically important axes by stratifying patients by cancer type, therapy and immune checkpoint targets (Fig. 3 and Supplementary Fig. 9).
We compared COMPASS-PFT against top-performing methods (PGM, NetBio and Teff) and found consistently higher accuracy and precision-recall performance across settings. In cross-indication prediction (Fig. 3a), a task critical for indication selection in clinical drug development, COMPASS-PFT identified responders in cancer types excluded from training. For example, when lung adenocarcinoma (LUAD) was excluded from training, COMPASS-PFT achieved 76.5% accuracy on the held-out cohort (Supplementary Table 4). These results demonstrate that COMPASS can distinguish generalizable features of antitumor immunity from indication-specific transcriptional variation.
In cross-therapy and cross-target evaluations (Fig. 3b,c), COMPASS-PFT generalized across regimens and checkpoint targets (70.8% accuracy for anti-CTLA-4 when trained on PD-1/PD-L1 cohorts; Supplementary Table 5), indicating shared immune mechanisms. The cancer type token ablation studies on cross-indication and cross-target generalization show that the performance is not driven by type-specific prevalence of response (Supplementary Fig. 10). Another clinically relevant problem is predicting responses to combination therapies (ipilimumab plus pembrolizumab) using models trained on non-combination cohorts. Here, COMPASS-PFT achieved 85.3% accuracy when trained only on monotherapy cohorts (Fig. 3b and Supplementary Fig. 11).
We also tested generalizability across technical factors, including sequencing platforms and biopsy sites (Supplementary Fig. 12). COMPASS-PFT remained robust, whereas signature-based models were sensitive to platform and site differences.
Multi-stage fine-tuning improves prediction for new therapies and cancer types
In clinical development, early-stage trials provide limited target-specific data, making indication selection and patient enrichment challenging. COMPASS uses a multi-stage fine-tuning (MSFT) strategy to build robust, treatment-specific models from small clinical cohorts (Fig. 4a). MSFT sequentially pretrains on large transcriptomic data, then fine-tunes on pan-cancer ICI cohorts and, finally, refines on the target drug or combination, transferring shared immune-response features to therapy-specific settings.
We evaluated MSFT by developing drug-specific models for three ICIs: atezolizumab (anti-PD-L1), pembrolizumab and nivolumab (both anti-PD-1 therapies) (Methods). Models were pretrained, fine-tuned on ICI cohorts excluding the target drug/class and refined on a single target-drug cohort and then tested on held-out cohorts treated with the same drug (Supplementary Table 7).
MSFT outperformed single-stage fine-tuning strategies and existing drug-specific models (Fig. 4b–d). In predicting atezolizumab response in kidney renal clear cell carcinoma (KIRC, n = 89), MSFT achieved 73.7% accuracy compared to 70.3% for single-stage fine-tuning on the drug-specific cohort alone (single-stage fine-tuning 1 (SSFT1)) and 60.7% when fine-tuning models using only pan-cancer data (single-stage fine-tuning 2 (SSFT2)).
We also applied MSFT to disease-specific prediction tasks (Methods). For LUAD, we predicted pembrolizumab responses (n = 33) (Supplementary Fig. 13). MSFT reached 91% accuracy. By contrast, SSFT1 trained only on the LUAD cohort achieved 67% accuracy. Thus, MSFT improves prediction in small treatment-specific or disease-specific settings.
COMPASS predicts survival and reveals resistance mechanisms beyond immune phenotypes
We characterized the 44 interpretable TIME concepts learned by COMPASS, including cross-cohort stability, associations with response and comparisons to fixed gene set scoring approaches (Supplementary Figs. 14–19 and Extended Data Figs. 1–3). We next evaluated the clinical relevance of these concepts by applying COMPASS to IMvigor210, a held-out phase 2 trial of atezolizumab (anti-PD-L1) in metastatic urothelial carcinoma21,22, to assess whether it predicts long-term outcomes and reveals resistance mechanisms. To prevent data leakage, we used a COMPASS-PFT model fine-tuned on all other ICI-treated cohorts, excluding IMvigor210.
Patients classified by COMPASS as responders had improved overall survival compared to non-responders (Fig. 5a). Response probabilities outperformed concept-based risk scores in stratifying outcomes (Methods and Supplementary Fig. 20).
Among n = 298 patients, those with response probability (PR) ≥ 0.5 showed a 1-year overall survival rate of 86% compared to 40% for those with PR < 0.5, yielding a hazard ratio of 4.7 (log-rank P = 1.7 × 10⁻⁷; Supplementary Fig. 20b). Comparisons with TMB and PD-L1 immune-cell (IC) score were restricted to patients with available TMB data (n = 234; hazard ratio = 4.37, 95% confidence interval: 2.29−8.32) (Fig. 5a). COMPASS outperformed TMB (hazard ratio = 1.67, P = 0.0038), PD-L1 IC2+ scoring (≥5% of tumor-infiltrating PD-L1+ immune cells; hazard ratio = 1.75, P = 0.0018) and IHC-based immune phenotype (hazard ratio = 1.85, P = 0.0042) (Fig. 5b–d)23. Calibration analysis showed good agreement between COMPASS-predicted probabilities and observed response rates (Brier score = 0.212 versus 0.241 for TMB); decision-curve analysis further demonstrated positive net benefit across clinically relevant threshold probabilities, similar to TMB and exceeding PD-L1 IC (Supplementary Fig. 35).
To explore immunological features that inform COMPASS predictions, we analyzed TIME concept scores across immune phenotypes defined by CD8+ T cell infiltration patterns (inflamed, excluded and desert)23 (Methods). Inflamed tumors showed high activation of proinflammatory concepts, including Cytotoxic T Cell, IFNγ Pathway, Immune Checkpoint and Macrophage as well as elevated Genome Integrity and Cell Proliferation (Fig. 5e and Extended Data Fig. 4). These concept scores positively correlated with the expression of genes underlying the learned concepts. Desert tumors lacked activation of proinflammatory concepts (Cytotoxic T Cell) and exhibited elevated scores for dysfunctional or deficient immune components, including NK Cell, Innate Lymphoid Cell, B Cell General and Plasma Cell (Fig. 5e). These concept scores were negatively correlated with the expression of underlying genes, reflecting reduced infiltration or impaired functionality of the corresponding immune cells (Supplementary Figs. 21–23). Immune-excluded tumors displayed intermediate features, with lower activation of inflammatory programs than inflamed tumors and weaker immunodeficiency signals than desert tumors (Fig. 5e). These tumors showed activated TGFβ Pathway and Endothelial concepts, consistent with immunosuppressive stromal remodeling and vascular exclusion.
We also examine how COMPASS resolves the heterogeneity of ICI responses within and between immune phenotypes. Patients were stratified into four groups based on their response and phenotype: inflamed responders and non-inflamed non-responders (groups showing the expected clinical outcome based on conventional immune phenotype) and non-inflamed responders and inflamed non-responders (groups showing an unexpected clinical outcome based on immune phenotype classifications). We cluster concept profiles for correctly predicted cases (Fig. 5f, Extended Data Fig. 5 and Methods).
Inflamed responders formed two major clusters, both characterized by a strong activation of proinflammatory concepts (Cytotoxic T Cell and IFNγ Pathway) and absence of immunosuppression or immunodeficiency signals. These clusters differed in TMB-associated concept activity, particularly Genome Integrity and Cell Proliferation (Extended Data Fig. 4b), with one cluster showing strong activation of these concepts and the other lacking it. Non-inflamed responders clustered into two groups, exhibiting intermediate proinflammatory activation but lacking immunosuppression signals, which distinguished them from non-responders. These patients comprised predominantly immune-excluded tumors, phenotypes generally associated with a lack of response to ICI, exemplifying how RNA-seq provides information on functional immune states beyond traditional IHC classification.
More heterogeneity in grouping was observed among non-responders. Inflamed non-responders are of particular interest, because, according to conventional immune phenotypes, they would be predicted to be responders, yet COMPASS correctly identified these patients as non-responders. These patients displayed variable proinflammatory levels but were unified by the presence of distinct resistance mechanisms. A first cluster showed strong activation of the Endothelial concept, reflecting angiogenesis and vascular remodeling processes that create a physical barrier to T cell infiltration, impairing immune cell trafficking. A second cluster exhibited high TGFβ Pathway concept activation; TGFβ signaling promotes stromal remodeling and fibrosis via cancer-associated fibroblast activation, excluding T cells from the tumor microenvironment23,24. The remaining three clusters were characterized by CD4+ T cell immunosuppression and B cell deficiency. These clusters exhibited T helper 17 (TH17)-like CD4 programs with concurrent TGFβ signaling, consistent with a suppressive TH17 phenotype25 (Supplementary Fig. 22). The deficiency of B cells, a cell type associated with the presence of tertiary lymphoid structures and survival benefit to ICI26, further suggests a loss or dampening of adaptive immune responses critical for antitumor immunity. Non-inflamed non-responders also exhibited heterogeneity, forming four distinct clusters. The largest cluster comprised patients without proinflammatory activation. Two clusters showed minimal proinflammatory signals with strong TGFβ activation, whereas another cluster exhibited strong Endothelial concept-driven immune exclusion. These results show that COMPASS stratifies patients by survival outcomes and suggests resistance mechanisms between and within immune phenotypes.
COMPASS generates personalized response maps to explain individual patient predictions
We developed personalized response maps that trace how COMPASS links patient-specific gene expression to predicted outcomes through its concept bottleneck across five levels: gene expression, encoder representations, granular immune concepts, aggregated TIME concepts and the final response probability. Personalized response maps trace how individual gene activations in the personalized transcriptome propagate through biological pathways to immunological concepts, where they are integrated and transformed to produce the final prediction. We generated personalized response maps for representative patients from each immune-response cluster in Fig. 5f. Four illustrative examples are shown in Fig. 6, with additional cases provided in Supplementary Figs. 24–27.
The response maps reveal how diverse immune profiles influence predicted outcomes. An inflamed responder shows broad IFNγ and cytotoxic activation with minimal immunosuppression (Fig. 6a; PR = 1.0), whereas an immune-desert responder shows strong Genome Integrity and moderate IFNγ concept activations, consistent with a TMB-associated mechanism (Fig. 6b; PR = 0.80). By contrast, an inflamed non-responder shows co-activation of TGFβ signaling and B cell deficiency (Fig. 6c; PR = 0.22), and a desert non-responder shows dominant immunodeficiency features (Fig. 6d; PR = 0). Activation response maps link genes to concept activations, providing mechanistic context for predictions and supporting hypothesis generation.
Discussion
ICIs have improved outcomes across multiple cancer types, but response rates remain low, and biomarkers such as TMB and PD-L1 IHC often fail to stratify patients accurately. Here we present COMPASS, a concept bottleneck model that predicts immunotherapy response from transcriptomic data and provides mechanistic insight into response variability. COMPASS enables accurate prediction with concept-level interpretation to highlight resistance mechanisms and support trial-oriented hypothesis generation.
COMPASS complements emerging prognostic models that leverage real-world data27, clinico-genomic profiles20,28, imaging29 and routine blood tests30 by providing mechanistically interpretable transcriptomic features. Unlike population-level risk predictors that rely primarily on systemic host factors (for example, neutrophil-to-lymphocyte ratio and albumin), COMPASS encodes tumor transcriptomes into 44 immune concepts that capture tumor-immune biology linked to response and resistance. Recent transformer-based models31 integrate clinical and genomic features, including standard gene signature scores. These models can incorporate COMPASS concept scores; in a Clinical Transformer predictor, COMPASS concepts improved survival prediction (Supplementary Methods, Supplementary Figs. 29–34 and Supplementary Tables 11 and 12), supporting a modular strategy in which transcriptomic encoders augment multimodal predictors. Additional benchmarking against transcriptomic-based machine learning methods (ENLIGHT13, EaSIeR16 and IRnet17) further confirmed the state-of-the-art performance of COMPASS (Supplementary Fig. 28).
Building upon its mechanistic foundation, COMPASS enables key applications in clinical development. Through MSFT, the model can be rapidly tailored to specific indications and drug regimens without losing interpretability. COMPASS stratifies patients by mechanistically distinct features of response, including cytotoxic T cell activity, IFNγ signaling and TGFβ pathway activation. Through personalized response maps that trace the contributions of individual genes and immune concepts to predicted outcomes, COMPASS provides interpretable patient-level maps to support mechanistic interpretation of model predictions. These maps could support biomarker-driven patient enrichment and generate testable hypotheses, and concept trajectories could help track pharmacodynamic changes in clinical trials. However, explanation faithfulness has not been evaluated through concept ablation or input perturbation, and the learned concepts have not been experimentally validated. Accordingly, they should be regarded as hypothesis-generating tools rather than established mechanistic biomarkers.
COMPASS integrates pan-cancer transcriptomic pretraining with a concept bottleneck architecture that encodes immune concepts derived from curated gene signatures. This design improves generalizability across cancers and checkpoint therapies while maintaining interpretability, including in small datasets via parameter-efficient adaptation. By modeling functional immune states, COMPASS resolves heterogeneity that conventional immune phenotypes cannot. It distinguishes responders within both inflamed and non-inflamed tumors and reveals resistance mechanisms in patients who fail treatment despite high immune infiltration. These mechanisms include TGFβ signaling, endothelial exclusion, CD4+ T cell dysfunction and B cell deficiency. The findings extend previous results from the IMvigor210 study23, which linked TGFβ activity and tertiary lymphoid structures to immunotherapy outcomes.
Limitations of COMPASS include reliance on bulk RNA-seq, which lacks spatial resolution and may obscure signals from rare immune cell populations. Integrating single-cell or spatial transcriptomic data could improve resolution of cell-specific and spatially restricted immune states32,33. Another limitation is the absence of multivariable adjustment for clinical covariates such as age, sex and tumor stage, as these variables were incompletely and heterogeneously annotated across the 16 cohorts, precluding harmonized adjustment. In addition, the lack of non-ICI comparator arms prevented separation of predictive from prognostic effects. We, therefore, caution that COMPASS predictions may reflect a mixture of both signals. Addressing these limitations will require harmonized cohorts, covariate-adjusted analyses and prospective controlled studies.
Predictions by COMPASS or similar models should never be used alone to deny immunotherapy. Clinical deployment remains challenging and will require assay validation, cross-platform calibration and reproducible inference pipelines. Although promising, COMPASS remains an exploratory tool requiring prospective validation through clinical trials to define its appropriate use in therapeutic decision-making.
COMPASS links tumor transcriptomes to interpretable immune representations and supports biomarker discovery, mechanistic hypothesis generation and patient stratification in immunotherapy trials. Its performance across cancer types and checkpoint inhibitor therapies supports the use of mechanistically interpretable immune modeling in translational research and clinical development.
Methods
This study is a computational analysis using deidentified datasets. No new patient data were collected, and no ethical approval from an institutional review board or ethics committee was required. This section describes the following: (1) dataset curation and preprocessing, (2) the COMPASS model, (3) self-supervised pretraining of COMPASS, (4) supervised fine-tuning for response prediction, (5) benchmarking COMPASS models against established methods, (6) MSFT for drug-specific and disease-specific models, (7) SHapley Additive exPlanations (SHAP) analysis of important features, (8) overall survival analysis, (9) TIME concept analysis in the IMvigor210 cohort and (10) personalized response maps generation.
Dataset curation and processing
TCGA datasets
Pretraining datasets were acquired from TCGA via the Genomic Data Commons (GDC) portal (version 37; GDC Portal), using TCGAbiolinks for data retrieval. To ensure cross-cohort compatibility with downstream ICI analyses, all RNA-seq data are uniformly processed through our standardized pipeline. Read alignment was performed against the GRCh38/hg38 reference genome using STAR (version 2.7.5c), with gene features annotated according to GENCODE version 36.
Raw counts are normalized by gene effective length and converted to transcripts per million (TPM):
where \(N\) is the number of genes and
This normalization facilitates cross-sample comparability. Initial data included 60,660 genes across 11,274 samples. After excluding normal tissue samples, 10,534 samples remained. Further exclusions were applied for previous treatment samples and non-formalin-fixed paraffin-embedded (FFPE) samples, resulting in 10,305 samples. Finally, aggregation to the patient level using the ‘bcr patient barcode’ key yielded 10,184 unique patient tumor samples. Protein-coding genes are selected (15,672 genes) based on overlap with the gene expression data from the clinical cohorts.
ICI clinical cohorts
We curate 16 cohorts (Fig. 2a) spanning seven cancer types, categorized into three groups: large cohorts (>100 patients), medium-sized cohorts (30−100 patients) and small cohorts (<30 patients). Publicly available RNA-seq data underwent uniform processing through the same standardized pipeline that was used to process the TCGA data (see previous section), converting raw sequencing data (FASTQ) to counts and TPM values. For cohorts with available raw data, FASTQ files were reprocessed; otherwise, TPM values were derived from the counts using TCGA-aligned gene lengths. To ensure cross-cohort consistency, all data were mapped to the same reference genome, correcting for potential differences in original genomic builds. To ensure reproducibility, researchers may download raw data using accession IDs in Extended Data Table 1 and reprocess them via our publicly available code (https://github.com/mims-harvard/COMPASS-web/tree/main/mRNA_pipeline which includes parameters for alignment, quantification and TPM conversion. All steps rely on the GRCh38 reference genome and GENCODE version 36 annotations to maintain cross-cohort consistency. Only pretreatment samples are included. Responders are defined as patients achieving partial response or complete response, and non-responders include those with stable disease or progressive disease, per Response Evaluation Criteria in Solid Tumors version 1.1 (RECIST v1.1) best overall response (BOR) criteria as reported in source studies, unless otherwise noted. See Extended Data Table 1 for cohort overview.
Large immunotherapy cohorts
The IMvigor210 cohort (n = 298) includes patients with atezolizumab-treated bladder cancer (BLCA) (68 responders, 230 non-responders)22, with data sourced from the IMvigor210CoreBiologies (version 1.0.1) R package and Cancer Research Institute (CRI) iAtlas. The IMmotion150 cohort (n = 165) comprises patients with atezolizumab-treated clear-cell renal cell carcinoma (KIRC) (48 responders, 117 non-responders)34. For the cohort from Liu et al.36 (n = 107), posttreatment samples are excluded, retaining 41 patients with melanoma (nivolumab/pembrolizumab) classified as responders and 66 classified as non-responders. The Ravi-1 cohort (n = 102) is a subcohort of the SU2C-MARK non-small cell lung cancer (NSCLC) study35, focusing on patients with LUAD receiving PD-(L)1 ± CTLA-4 inhibitors.
Medium-sized immunotherapy cohorts
The Rose et al.41 cohort (n = 89) includes patients with BLCA treated with PD-(L)1 inhibitors (16 responders, 73 non-responders). The Gide et al.40 cohort (n = 73) comprises patients with melanoma receiving anti-PD-1 ± anti-CTLA-4 (40 responders, 33 non-responders). Additional cohorts include Riaz et al.6 (n = 51) with nivolumab-treated patients with melanoma (10 responders, 41 non-responders)6; Kim et al.39 (n = 45) with pembrolizumab-treated patients with stomach adenocarcinoma (STAD) (12 responders, 33 non-responders)39; Van Allen et al.38 (n = 39) with ipilimumab-treated patients with melanoma (26 responders (complete response/partial response or stable disease with overall survival >1 year) and 13 non-responders (progressive disease or stable disease with overall survival <1 year))38; and Freeman et al.37 (n = 34) with patients with melanoma from the MGH cohort treated with nivolumab, pembrolizumab, ipilimumab or combination therapies (12 responders, 22 non-responders)37.
Small immunotherapy cohorts
The Hugo et al.46 cohort (n = 26) involves pembrolizumab-treated patients with melanoma (14 responders and 12 non-responders by immune-related RECIST (irRECIST)). The Ravi-2 cohort (n = 25) represents a SU2C-MARK NSCLC substudy35 of patients with lung squamous cell carcinoma (LUSC) treated with PD-1 or PD-L1 inhibitors (eight responders, 17 non-responders). For the Zhao et al.45 cohort (n = 25), patients with glioblastoma (GBM) receiving nivolumab or pembrolizumab are classified as responders based on either (1) posttreatment histopathology showing inflammatory response with minimal/no residual tumor cells or (2) radiographic evidence of stable/shrinking tumor volume over 6 months. The Snyder et al.44 cohort (n = 21) includes atezolizumab-treated patients with BLCA (seven responders, 14 non-responders). For patients with KIRC: the Choueiri et al.42 cohort (n = 16) contains nivolumab-treated cases (three responders, 13 non-responders), whereas the Miao et al.43 cohort (n = 17) includes patients receiving PD-(L)1 ± CTLA-4 inhibitors (five responders, 12 non-responders)43, both sourced from CRI iAtlas. No new datasets were generated in this study.
COMPASS model
The COMPASS model comprises three key components. The first component, a transformer-based gene language model (GLM), serves as the ‘encoder’ to generate contextualized representations of individual genes. Next, a hierarchical ‘projector’ transforms these gene-level embeddings into high-level biological concepts, including immune cell types and pathways. The final component, a ‘classifier’, performs immunotherapy response prediction from the concept representations, employing either a multilayer perceptron (MLP) or a non-parametric, similarity-based method for zero-shot prediction.
GLM encoder
The GLM adapts natural language modeling techniques to transcriptomic data32, where each gene is treated as a token. Unlike natural language where tokens follow a clear sequential structure, gene expression profiles are inherently unordered and represented in tabular format. This difference renders positional encodings, such as fixed sinusoidal encodings used in natural language processing, suboptimal for capturing gene−gene relationships. Drawing inspiration from FT-Transformer56, which is designed for tabular data, we introduce a learnable gene-specific positional bias that enables the model to capture contextual interactions between genes in a biologically informed, data-driven manner.
Gene abundance embedding
Let \({{\bf{X}}}_{\text{gene}}\in {{\mathbb{R}}}^{B\times L}\) denote the input gene expression matrix, where \(B\) is the batch size and \(L\) is the number of genes. Each gene is embedded into a d-dimensional latent space using a learnable embedding matrix \({\bf{W}}\in {{\mathbb{R}}}^{L\times d}\), initialized from a uniform distribution:
To generate expression-aware embeddings, we scale each geneʼs embedding vector by its corresponding expression value. Specifically, the embedding for the l-th gene in the b-th sample is given by:
for \(b=1,\ldots ,B\) and \(l=1,\ldots ,L\), resulting in the embedding tensor \({{\bf{E}}}_{\text{gene}}\in {{\mathbb{R}}}^{B\times L\times d}\). This design enables the model to capture both gene identity (via W) and sample-specific abundance (via \({{\bf{X}}}_{\text{gene}}\)) in the representation.
Learnable positional encoding
To inject gene-specific inductive biases into the model, we introduce a learnable positional encoding matrix \({\bf{P}}\in {{\mathbb{R}}}^{L\times d}\), initialized in the same manner:
Each gene receives a unique, trainable positional vector \({\bf{P}}\left[l,:\right]\), which acts as a contextual bias. The final input embedding for each gene in each sample is computed by element-wise addition of the positional encoding:
resulting in \({{\bf{E}}}_{\text{final}}\in {{\mathbb{R}}}^{B\times L\times d}\). Unlike fixed encodings, this learnable scheme allows the model to adaptively encode gene-level functional relevance during training, thereby serving as a gene-aware bias that enhances the transformerʼs capacity to model context-specific gene interactions.
Cancer type token embedding
To account for pan-cancer heterogeneity, COMPASS integrates a cancer type token that interacts with gene tokens through attention mechanisms and is separately projected as a concept in the modelʼs hierarchy. To generate the cancer type token embedding, the 33 cancer types are first encoded as integers (0−32). This integer encoding serves as an index for looking up a learnable embedding matrix:
Given a batch of cancer type labels \({{\bf{X}}}_{c}\in {{\mathbb{R}}}^{B}\), we perform a lookup to obtain their embeddings:
These embeddings are reshaped as \({{\bf{E}}}_{\text{cancer}}\in {{\mathbb{R}}}^{B\times 1\times d}\) and prepended to the gene embeddings along the sequence axis. This cancer type token interacts with gene tokens via self-attention and is later projected into a dedicated concept node in the concept hierarchy. As a robustness check, we ablated the cancer type concept during fine-tuning and reevaluated leave-one-indication-out and leave-one-target-out generalization; performance decreased moderately but remained substantial (Supplementary Fig. 10).
Transformer encoder for contextual learning
The full input to the transformer encoder is constructed by concatenating the cancer type token and gene embeddings:
This tensor passes through a multilayer transformer encoder composed of stacked self-attention and feedforward layers:
Within each layer, the self-attention mechanism enables each token to dynamically attend to all others, including gene−gene-type and gene−cancer-type interactions. The attention weights are computed via:
Given the large number of genes typically used in the model, full attention becomes computationally expensive. We use the Performer architecture57, which replaces standard attention with a linear approximation while preserving expressiveness. The architecture supports flash attention as an optional alternative to further reduce memory overhead and runtime.
The output tensor \({\bf{H}}\in {{\mathbb{R}}}^{B\times (L+1)\times d}\) encodes the contextualized representations of both the gene expression profile and cancer type context. Rather than directly using these latent features for prediction, we project them into an explicit, biology-grounded concept bottleneck via a hierarchical projector. The resulting interpretable concept representation serves as the exclusive input to the downstream response classifier.
Concept-based hierarchical projector
COMPASS follows the concept bottleneck paradigm, in which inputs pass through a layer of human-interpretable concepts rather than mapping directly from latent features to predictions. In concept bottleneck models, inputs map to a concept vector, and predictions are computed from these concepts, which support interpretability and concept-level intervention18. COMPASS introduces this architecture for cancer transcriptomics by leveraging immunological gene sets and a hierarchical gene → gene set → concept mapping to represent each patientʼs TIME. To transform gene embeddings into interpretable features, COMPASS uses a hierarchical projector with two outputs: (1) gene set scores, \({S}_{\text{Geneset}}\), where each score corresponds to a curated gene set, such as a pathway or immune cell signature; and (2) concept scores, \({S}_{\text{Concept}}\), which aggregate gene sets into functional modules, such as immune activation or immune suppression.
Granular concept (gene set) aggregation
Given a curated gene set \(G=\{{g}_{1},{g}_{2},\ldots ,{g}_{k}\}\) with \(k\) genes, we extract their contextualized embeddings from the GLM output \({{\bf{H}}}_{{\text{gene}}^{{\prime} }}\in {{\mathbb{R}}}^{B\times L\times d}\):
To aggregate the \(k\) gene vectors into a unified representation, we introduce a learnable attention vector \({{\bf{a}}}_{G}\in {{\mathbb{R}}}^{k}\), initialized from a normal distribution and normalized via a softmax transformation:
The attention-weighted gene set embedding is then computed as:
This aggregated vector is passed through a linear layer to produce the scalar score for gene set \(G\):
The full set of gene sets yields a tensor \({S}_{\text{geneset}}\in {{\mathbb{R}}}^{B\times K}\), where \(K\) denotes the total number of gene sets in the model. This internal latent representation captures modular biological information across curated pathways and cell types.
High-level concept aggregation
Each high-level concept \(C\) consists of a subset of gene sets \(\{{G}_{1},{G}_{2},\ldots ,{G}_{{k}_{C}}\}\), where \({k}_{C}\) is the number of gene sets associated with concept \(C\). The corresponding gene set scores \(\{{S}_{\text{geneset}}({G}_{1}),\ldots ,{S}_{\text{geneset}}({G}_{{k}_{C}})\}\) are aggregated using a second-level attention mechanism. A learnable attention vector \({{\bf{a}}}_{C}\in {{\mathbb{R}}}^{{k}_{C}}\) is normalized via a softmax transformation:
The high-level concept score is then computed as:
This attention-based aggregation allows each high-level concept to dynamically weight its constituent gene sets, enabling flexible and interpretable summarization of complex biological programs.
Final concept representation
COMPASS defines \(M=43\) high-level concepts derived from immune-related pathways, cell types and functional groups. One additional concept represents the cancer type. The final concept representation for a given patient is:
Here, the cancer type score is computed by projecting the cancer token embedding \({{\bf{H}}}_{\text{cancer}}\in {{\mathbb{R}}}^{B\times d}\) through a linear layer:
Together, \({{\bf{C}}}_{\text{final}}\) provides a biologically grounded and interpretable embedding of each patientʼs tumor microenvironment, suitable for downstream prediction and mechanistic analysis.
Prediction module
Prediction module in the COMPASS model performs the conversion of high-level concept representations into probabilistic predictions of immunotherapy response. To accommodate both standard supervised learning and generalization to new cohorts or cancer types, COMPASS supports two distinct classifier types: a parametric MLP and a non-parametric cosine similarity-based prototypical network. The latter is referred to as the NFT (no fine-tuning) classifier, as it operates without gradient-based optimization during inference. These classifier heads provide complementary strengths and can be selected based on the availability of training labels and the desired generalization behavior.
Parametric classifier using an MLP
The MLP classifier transforms high-level concept vectors into binary predictions via a trainable feedforward network. Given an input matrix \({\bf{X}}\in {{\mathbb{R}}}^{B\times 44}\), where \(B\) is the batch size and 44 is the number of concepts (43 biological concepts plus one cancer type), the inputs are first standardized:
The normalized vectors are then passed through fully connected layers, producing output logits \({\bf{Z}}\in {{\mathbb{R}}}^{B\times 2}\):
To calibrate output confidence, the logits are scaled by a learnable temperature parameter \(\tau\), defined as \(\tau =\exp (\log \_\text{temperature})\):
These scaled logits are transformed into probabilities using the softmax function:
The learnable temperature \(\tau\) allows the model to adjust the sharpness of its predictions and improves its ability to distinguish ambiguous cases, such as borderline responders.
Non-parametric classifier using prototypes
The NFT classifier adopts a prototypical network architecture58 that performs inference through similarity comparisons with labeled support examples, eliminating the need for model fine-tuning. This non-parametric approach is advantageous when limited training data prevent effective model adaptation. As illustrated in Supplementary Fig. 1a, the classifier begins with a support set of labeled patient embeddings, each represented by a high-level concept vector \({\bf{f}}\in {{\mathbb{R}}}^{44}\) and a binary response label. The support examples are grouped by class c ∈ {responder, non-responder}, and a class prototype is computed by averaging the normalized vectors in each group:
where \({{\bf{x}}}_{i}\in {{\mathbb{R}}}^{44}\) is the concept vector of the i-th support sample in class \(c\), and \({N}_{c}\) is the number of support examples in that class. The resulting prototypes \({{\bf{p}}}_{c}\) are unit normalized to enable cosine-based comparison.
Given a query patient with concept vector \({\bf{q}}\), the classifier computes the cosine similarity between the query and each class prototype:
The similarity scores are scaled by a fixed temperature \(\tau\) (typically 0.1) and then passed through a softmax layer:
Pretraining COMPASS on TCGA dataset
The COMPASS model was pretrained on bulk RNA-seq data from 10,184 patients across 33 TCGA cancer types using a self-supervised triplet contrastive learning approach. This framework learns to map tumor transcriptomes (TPM values) into a 44-dimensional concept embedding space that captures TIME features. During training, each triplet consists of an anchor sample (a patientʼs transcriptome), a positive sample (an augmented version of the same transcriptome) and a negative sample (a transcriptome from a different patient within the same cancer type). The model optimizes the embedding space to minimize cosine distance between anchor-positive pairs while maximizing separation from negative samples.
To address imbalance in TCGA cohort sizes across cancer types, we implemented balanced sampling with replacement, upweighting underrepresented cancer types during training. This ensures that all cancer types contribute proportionally to the learned representations.
Data augmentation
For contrastive learning, each anchor transcriptome undergoes stochastic transformation via one of two augmentation methods. Random masking independently zeros each gene’s expression value xi with probability \({p}_{{mask}}=0.1\) according to:
Alternatively, Gaussian jitter adds normally distributed noise to each value:
The augmentation method is selected randomly for each transformation event. We use random masking and Gaussian jitter, two widely used augmentations for contrastive learning on high-dimensional expression data. These augmentations promote robustness to technical variability, such as measurement noise. By analogy, computer vision uses domain-relevant augmentations such as rotation, cropping and brightness perturbation. Future work could develop biologically grounded augmentation strategies for RNA-seq. Sensitivity analyses showed that increasing masking probability or jitter magnitude reduced frozen-representation (NFT) performance but improved PFT performance, consistent with stronger perturbations acting as a form of representation regularization. Restricting negative sampling to local transcriptomic neighborhoods (smaller K) improved both NFT and PFT performance, supporting the importance of biologically structured hard-negative sampling (Supplementary Figs. 36 and 37 and Supplementary Methods 5).
Self-supervised training
The model is trained using a margin-based triplet loss function:
where \(\bf{a}\), \(\bf{p}\) and \(\bf{n}\) represent anchor, positive and negative COMPASS model embeddings respectively; cos denotes cosine similarity; and a default margin of 1 is used.
Training was conducted on NVIDIA Tesla A100 80GB GPUs with batch size 128 and learning rate 1 × 10⁻³ using the Adam optimizer. We reserved 1% of samples as a validation set for early stopping, with training halted if validation loss failed to improve for 10 consecutive epochs. For robustness, we performed three independent training runs with random seeds 24, 42 and 64, selecting the checkpoint with lowest validation loss.
Fine-tuning COMPASS for response prediction
After pretraining on TCGA, the COMPASS model is fine-tuned on ICI-treated cohorts to predict clinical response. To accommodate varying dataset sizes and quality across cohorts, we implemented four complementary fine-tuning strategies with differing levels of parameter adaptation: non-parametric zero-shot inference (COMPASS-NFT mode), linear probing (COMPASS-LFT mode), partial fine-tuning (COMPASS-PFT mode) and full model fine-tuning (COMPASS-FFT mode). These approaches provide a spectrum from maximal parameter efficiency (COMPASS-NFT) to full model adaptability (COMPASS-FFT).
All parametric modes (COMPASS-LFT, COMPASS-PFT and COMPASS-FFT) process the 44-dimensional concept vector through a single-layer dense classifier with 16 hidden units, generating logit outputs for binary response prediction. The trainable parameters vary substantially across modes: COMPASS-FFT updates all model parameters (approximately 1,018,784 total), including the GLM encoder and projector; COMPASS-PFT adapts only the classifier and projection layers (2,144 parameters); COMPASS-LFT modifies only the classifier head (182 parameters); and COMPASS-NFT maintains frozen pretrained weights with no trainable parameters, instead using prototypical inference based on cosine similarity in concept space.
For parametric modes, models are optimized using cross-entropy loss with learning rates between 10−3 and 10−2 (slightly higher than the pretraining learning rate to promote faster adaptation to new domains), batch sizes of 8−16 (scaled to cohort size and GPU memory) and weight decay (10−2 and 10−4) tuned per mode and dataset. Internal cross-validation determined optimal training epochs, with FFT typically converging faster but being more prone to overfitting compared to the more stable LFT and PFT approaches in small datasets. All experiments ran on NVIDIA Tesla V100 GPUs, with final model selection based on cross-validated validation performance. The COMPASS-NFT mode represents a distinct non-parametric approach where labeled samples from the training cohort serve as a support set to compute responder/non-responder prototypes in the frozen 44-dimensional concept space. New samples are classified by cosine similarity to these prototypes. This enables generalization to new domains without any additional gradient updates, making COMPASS-NFT ideal for low-data or zero-shot transfer scenarios.
Benchmarking immunotherapy response prediction models
Overview of existing methods
We evaluated COMPASS against 22 ICI response prediction methods (Supplementary Table 2). These methods encompass three main categories: (1) target gene markers (PD-1, PD-L1, CTLA-4 and their combination (GeneBio)47); (2) immune cell and functional signatures including Cytotoxic Immune Signature (CIS)48, T-effector-IFNγ Signature (Teff)49, Neoadjuvant Response Signature (NRS)50, IFNγ Signature Score (IFNG)9, Cytotoxic T Lymphocyte Markers (CTL)7, Tumor-Associated Macrophages (TAM)7,51, T Cell Exhaustion (Texh)7, Chemokine Signature Score (CKS)52, Cancer-Associated Fibroblast Signature Score (CAF)53, Roh Immune Score (IS)54, Immune Cytolytic Activity Score (ICA)55, CD8 Signature Score (CD8)47, MHC I Association Immune Score (MIAS)10 and T Cell-Inflamed Gene Expression Profile Score (GEP)10,11; and (3) comprehensive integrative methods including Tumor Immune Dysfunction and Exclusion Score (TIDE)7, Immuno-Predictive Score (IMPRES)8, Paired Gene Markers (PGM)37 and Network-Based ICI Treatment Biomarkers (NetBio)47.
For benchmarking, we implemented logistic regression models using the marker gene or predictive score from each method (detailed in Supplementary Table 2) as input features. For each model, we performed hyperparameter optimization via scikit-learn GridSearchCV, employing L2 regularization with the LBFGS solver. All models incorporated balanced class weighting and were configured with a maximum of 1010 iterations to guarantee convergence. Through five-fold cross-validation grid search across the regularization strength range (\(C\in [\mathrm{0.1,1}]\)), we identified the optimal parameter value using the area under the ROC curve (AUC) as scoring metric. This optimized C value was subsequently used to finalize each logistic regression model for comparative performance evaluation across all methods.
Cross-cohort and within-cohort model evaluation
To assess model performance across clinically relevant scenarios, we implemented three complementary validation strategies. First, leave-one-cohort-out validation evaluates cross-cohort generalization by training models on all available cohorts except one held-out cohort and then testing performance exclusively on the excluded cohort. Second, cohort-to-cohort transfer prediction provides a stringent assessment of cross-cohort generalizability by training models on a single complete cohort and directly predicting outcomes for patients from an entirely different cohort. Third, within-cohort leave-one-patient-out validation assesses performance through iterative training on all patients except one within individual cohorts, followed by testing on each excluded patient. This approach estimates performance in homogeneous settings while effectively controlling for overfitting. These strategies serve distinct purposes. Leave-one-cohort-out and cohort-to-cohort transfer prediction examine external validity across clinical study populations, whereas leave-one-patient-out validation evaluates within-study performance.
Two methods, NetBio and TIDE, are tailored to specific therapies and cancer types. NetBio selects the top 200 therapy-specific genes corresponding to the treatment regimen (‘PD-1’, ‘PD-L1’, ‘PD-1_CTLA-4’ or ‘PD-1_PD-L1_CTLA-4’)47, whereas TIDE employs distinct scoring models for melanoma and NSCLC, with all other cancer types processed through a generalized ‘Other’ category7. To ensure consistency and transparency across all methods, we summarized in Supplementary Table 2 the originally designed cancer type(s) and therapy/target contexts for NetBio, TIDE and 20 other published methods. During cross-cohort transfer evaluations, each method was applied in configurations aligned with the characteristics of the corresponding test cohort, following its original published implementation.
Evaluation metrics and reference performance
We evaluated model performance using three complementary metrics: accuracy, MCC and AUPRC. MCC and AUPRC were included as robust measures for class-imbalanced datasets. Accuracy was computed by binarizing predicted response probabilities using a fixed decision threshold of 0.5 across all cohorts and analyses rather than selecting cohort-specific thresholds; using a fixed threshold avoids cohort-dependent calibration and threshold-optimization effects and supports comparability across settings. To contextualize accuracy under class imbalance and facilitate interpretation of cross-cohort transfer results, we report cohort-specific baseline/reference metrics derived from the test cohortʼs response distribution. These baselines represent the expected performance if predictions were made knowing only the responder prevalence in the test cohort (information unavailable to the models during prediction):
where R and NR denote the counts of responders and non-responders in the test cohort, respectively. These formulations naturally account for class imbalance, with perfectly balanced cohorts (R = NR) yielding reference values of 50% accuracy and 0.5 precision (see cohort-specific distributions in Supplementary Fig. 8). For our 240 cohort-to-cohort transfer evaluations, we defined successful transfer as cases where model accuracy surpassed the target cohort-specific reference accuracy.
MSFT for drug-specific and disease-specific prediction
Overview of MSFT
The MSFT adapts COMPASS to new therapeutic contexts. This process begins with coarse fine-tuning on heterogeneous ICI-treated cohorts, followed by fine-tuning on drug-specific or disease-specific datasets (Fig. 4a). The first fine-tuning stage establishes general ICI response prediction capabilities, capturing pan-cancer TIME features. The second fine-tuning stage optimizes these features for specific drug mechanisms or clinical populations. This approach can improve robustness when fine-tuning on a small cohort would risk overfitting. We evaluated MSFT against two single-stage approaches (SSFT1: direct fine-tuning on drug-specific or indication-specific cohorts; SSFT2: fine-tuning on pan-cancer ICI cohorts) along with two reference models (PGM trained on SSFT1 data and baseline/reference performance for the test cohort as described in Methods).
For each assessment, clinical cohorts were split into two mutually exclusive groups: (1) pan-cancer ICI cohorts for coarse fine-tuning stage 1 and (2) drug-specific or disease-specific cohorts. The drug-specific or disease-specific cohorts were further split into disjoint training and test cohorts for cross-cohort transfer assessment. Figure 4 and Supplementary Table 7 provide an overview of dataset configurations. When developing drug-specific models, drugs with the same target were excluded from the pan-cancer ICI cohorts. For example, when developing pembrolizumab-specific models, all other anti-PD-1 drugs were excluded from the pan-cancer ICI dataset.
Dataset splits
We applied MSFT to three ICIs: atezolizumab (anti-PD-L1), pembrolizumab (anti-PD-1) and nivolumab (anti-PD-1). For atezolizumab, the drug-specific training cohort comprised 354 patients (IMvigor210: n = 298 BLCA; Rose: n = 35; Snyder: n = 21), with testing performed on 176 patients with KIRC (IMmotion150: n = 165; Miao: n = 2). Pembrolizumab-specific models were trained on 120 patients with melanoma (Liu: n = 62; Gide: n = 32; Hugo: n = 26) and evaluated on 78 gastric/lung cancer cases (Kim: n = 45; Ravi-1 LUAD: n = 33). Nivolumab models utilized 105 patients with melanoma for training (Riaz: n = 51; Liu: n = 45; Gide: n = 9) and 63 patients without melanoma for testing (Ravi-1 LUAD: n = 49; Ravi-2 LUSC: n = 14). Consistent with our exclusion criteria, the pan-cancer ICI cohorts used for coarse fine-tuning excluded any cohorts treated with drugs sharing the same target mechanism (for example, all anti-PD-1 therapies were excluded for pembrolizumab/nivolumab studies). For population-specific adaptation in LUAD (Supplementary Fig. 13), the training data consisted of 69 patients in the Ravi-1 cohort treated with non-pembrolizumab therapies, whereas testing used a held-out set of 33 pembrolizumab-treated patients with LUAD from the same cohort. As with drug-specific models, the pan-cancer ICI fine-tuning stage excluded all patients with LUAD to prevent data leakage.
SHAP concept importance analysis
SHAP analysis59 was used to quantify the contribution of each high-level concept to ICI response prediction. Using the Kernel SHAP implementation in the shap package (version 0.46.0), we analyzed a COMPASS-PFT model that was trained on all cohorts. The analysis was performed at pan-cancer and cancer-specific levels (BLCA, KIRC, skin cutaneous melanoma (SKCM), LUAD, STAD, GBM and LUSC; Supplementary Fig. 18).
A key step in the SHAP workflow was the selection of a background dataset. To capture the underlying data distribution, we applied k-means clustering to generate 100 centroid points from the input data. In cases where fewer than 100 samples were available, the entire dataset was used as the background. SHAP values were computed separately for responder (R) and non-responder (NR) classes, and the final ranking of the 44 high-level concepts was derived from the mean absolute SHAP values across all patients within each dataset.
Patient survival analysis
We examined COMPASS prediction of long-term clinical outcomes using its learned concept representations and predicted response probabilities. COMPASS acts as (1) a feature extractor that generates gene (Sgene), granular concept (Sgeneset) and high-level concept (Sconcept) features for risk modeling and (2) a predictor of treatment response probabilities. These approaches were evaluated on the IMvigor210 cohort: COMPASS, TMB, PD-L1 (IC) and IHC immune phenotype. All survival analyses used overall survival as the endpoint, with censoring applied according to the original study criteria23. For statistical analysis, we used the lifelines package (version 0.27.8) to generate Kaplan−Meier survival curves, calculate log-rank test P values and compute hazard ratios with 95% confidence intervals.
Survival analysis using COMPASS-derived features
For survival analysis, we used COMPASS-PFT trained on all cohorts except the IMvigor210 cohort (using leave-one-cohort-out approach). We extracted 132 concept and 44 high-level concept features as inputs for ridge-regularized Cox (RCOX) proportional hazard models. The RCOX models were trained on a combined dataset of 562 patients with available survival data, excluding the IMvigor210 cohort. Feature values were standardized using z-score normalization. Implementation used the scikit-survival package (version 0.20.0) with regularization parameter (α) optimized through five-fold cross-validation to maximize concordance index (C-index). Final risk scores were normalized to a 0−1 range using min−max scaling based on the training data. For testing on the IMvigor210 cohort, feature standardization and risk score scaling were applied using scalers fitted on the training data. Patients in the test set were stratified into high-risk and low-risk groups based on the top 10% risk score cutoff derived from the training set. The granular concept-based RCOX model classified 261 patients into high-risk group and 37 patients into low-risk group. The high-level concept-based RCOX model classified 264 patients into high-risk group and 34 patients into low-risk group. Kaplan−Meier plots were generated based on this stratification (Supplementary Fig. 20a).
Survival analysis using COMPASS-predicted response probabilities
The COMPASS-PFT model (trained excluding IMvigor210 as described above) generated response probabilities (PR), stratifying patients into responders (PR ≥ 0.5, n = 42) and non-responders (PR < 0.5, n = 256). Kaplan−Meier analysis assessed survival differences between these groups (Supplementary Fig. 20b).
Comparative analysis against established biomarkers
We evaluated COMPASSʼs performance relative to three biomarkers in the IMvigor210 cohort (limited to patients with TMB data, n = 234). Patients were stratified using standard cutoffs23:
-
TMB: High (≥10 mutations per megabase (mut/Mb), n = 97) versus low (<10 mut/Mb, n = 137).
-
PD-L1 (IC): IC2+ (n = 90) versus IC0/1 (n = 144)
-
IHC immune phenotype: inflamed (n = 56) versus non-inflamed (combined desert and excluded, n = 149)
Analysis of immune concepts in the IMvigor210 cohort
To explore biological relevance of COMPASS concepts for response prediction in IMvigor210 cohort, we analyzed concept scores generated by the COMPASS-PFT model that was trained on all ICI cohorts except IMvigor210 (leave-one-cohort-out approach). We computed the Pearsonʼs correlation coefficient between each concept score Sconcept and predicted probability of response P(R|NR) in the held-out IMvigor210 cohort. Concept scores were ranked based on the strength of their correlation with predicted responders (R) and non-responders (NR). The top 16 most strongly correlated scores were selected for downstream analysis. These included eight concepts positively associated with responder prediction (PR): Macrophage, IFNγ Pathway, Genome Integrity, Cell Proliferation, Cytotoxic T Cell, T Cell General, pDC and Immune Checkpoint; and eight concepts that were positively associated with non-responder prediction (PNR): NK Cell, Exhausted T Cell, B Cell General, Plasma Cell, Innate Lymphoid Cell, CD4 T Cell, TGFβ Pathway and Endothelial (Supplementary Fig. 21).
Functional categorization and gene expression analysis of COMPASS concepts
We analyzed associations between COMPASS concept scores and expression levels of their constituent genes. Specifically, Pearsonʼs correlation coefficients were computed between each concept score and the TPM expression levels of its corresponding genes. Genes were then ranked from most negatively to most positively correlated, and the proportions of positive and negative correlations were summarized in Supplementary Fig. 22. Based on their immunological roles and gene correlation patterns, 16 concepts were grouped into four functional categories: proinflammatory (Macrophage, IFNγ Pathway, Cytotoxic T Cell, T Cell General, pDC, Immune Checkpoint), TMB-associated (Genome Integrity, Cell Proliferation; Extended Data Fig. 4b), immune-exclusion (TGFβ Pathway, Endothelial) and immune-deficiency (NK Cell, Exhausted T Cell, B Cell General, Plasma Cell, Innate Lymphoid Cell, CD4 T Cell).
Analysis of personalized patient COMPASS profiles
To examine patient heterogeneity, we stratified patients into four subgroups based on their COMPASS-predicted response probabilities and immune phenotypes: inflamed responders (PR ≥ 0.5, n = 10), non-inflamed responders (PR ≥ 0.5, n = 13), inflamed non-responders (PR < 0.5, n = 33) and non-inflamed non-responders with strong non-response predictions (PR < 0.0001, n = 37). For each group, the z-score normalized COMPASS concept scores (top 16) were visualized in a heatmap. Patients were clustered using hierarchical clustering with cosine distance and complete linkage to reveal intra-group patterns (inflamed responders: clusters A1, A2 and A3; non-inflamed responders: clusters B1 and B2; inflamed non-responders: clusters C1, C2, C3, C4 and C5; non-inflamed non-responders: clusters D1, D2, D3 and D4). The average concept score across patient clusters is shown in Fig. 5f. Each patient was annotated with their predicted PR, immune phenotype (inflamed, excluded, desert), TMB (TMB-high versus TMB-low, using a threshold of 10 mut/Mb) and patient ID (Extended Data Fig. 5).
Generation of personalized response maps
Personalized response maps show how patient information propagates within COMPASS, enabling interpretation of how molecular features contribute to response prediction. By tracing the flow of information from input gene expression (XgeneTPM) through successive layers of gene scores (Sgene), granular concept scores (Sgeneset) and high-level concept scores (Sconcept) to predicted probability P(R|NR), these maps reveal the biological reasoning underlying the modelʼs predictions (Fig. 6 and Supplementary Figs. 24–27).
Gene expression input layer
The first layer of personalized response maps represents the input gene expression matrix \({\bf{X}}_{\text{geneTPM}}\in {{\mathbb{R}}}^{B\times L}\), where \(B\) is the number of patients and \(L\) is the number of genes. All input expression values are z-score normalized within the cohort, such that the value for gene g in a given patient reflects its relative expression compared to other patients:
where \({x}_{g}\) is the log2(TPM + 1) value of gene \(g\), and \({\mu }_{g}\), \({\sigma }_{g}\) are the cohort-level mean and standard deviation.
COMPASS gene score layer
Gene scores Sgene are computed by treating each gene as a singleton granular concept and applying the same projection process used for curated gene sets. Specifically, the transformer-based GLM produces contextualized gene embeddings \({{\bf{X}}}_{\text{geneGLM}}\in {{\mathbb{R}}}^{B\times L\times d}\), where each gene embedding incorporates both the geneʼs expression and its interactions with other genes through self-attention. Each gene embedding is then mapped to a scalar gene score using a linear projection layer:
This formulation ensures that gene scores are computed analogously to granular concept scores, as they use the same scoring approach. The resulting Sgene reflects both individual gene activity and its contextual relevance.
COMPASS granular concept, high-level concept and prediction layers
Gene scores Sgene are aggregated into granular concept scores Sgeneset using attention-based weighting mechanisms that learn each geneʼs contribution to its associated gene set. Each granular concept is projected into a scalar score using a shared linear layer applied to the weighted combination of gene embeddings. The granular concept scores are further aggregated into high-level concept scores \({\bf{S}}_{\text{concept}}\in {{\mathbb{R}}}^{B\times 43}\), where each score represents a broader functional module (for example, immune cell types or signaling pathways). A second-level attention step is used to learn the relevance of each granular concept to its parent high-level concept. These scores are used to compute the overall response probability P(R|NR), representing the likelihood that the patient will benefit from immunotherapy.
Interactive COMPASS exploration tool
To generate personalized response maps for the IMvigor210 cohort, we used COMPASS-PFT (trained on all ICI cohorts except IMvigor210; leave-one-cohort-out approach). These maps display z-score normalized features across hierarchical layers, highlighting inter-patient variation rather than absolute magnitude. Edge weights between layers represent the importance of each connection and are estimated by computing Pearsonʼs correlations between the z-scores of source and target nodes across the cohort. COMPASS tool highlights the top 16 high-level concepts (eight associated with response and eight with non-response, as shown in Supplementary Fig. 21) and features exceeding user-specified thresholds (genes with \({|z|} > 1\) in the input layer or concepts with \({|z|} > 0.5\) in projection layers). Personalized response maps in Extended Data Fig. 6 illustrate how COMPASS can zoom in on concepts (cytotoxic T cell activation) that drive predictions in each patient.
Reporting summary
Further information on research design is available in the Nature Portfolio Reporting Summary linked to this article.
Data availability
The pan-cancer TCGA datasets, including gene expression and mutation data, are available from the GDC Portal (https://portal.gdc.cancer.gov/ version 37). Clinical data for TCGA patients are provided in Liu et al.60. The datasets for the IMmotion150 cohort (European Genome-phenome Archive (EGA) accession: EGAS00001002928)34, the IMvigor210 cohort (EGA accession: EGAS00001002556)22 and IMvigor210CoreBiologies (version 1.0.1, ref. 23), Choueiri et al.42, Zhao et al. (Sequence Read Archive (SRA) accession: PRJNA482620)45, Miao et al. (database of Genotypes and Phenotypes (dbGAP) accession: phs001493.v1.p1)43 and Kim et al. (European Nucleotide Archive (ENA) accession: PRJEB25780)39 are available from CRI iAtlas (https://cri-iatlas.org/ and Synapse (https://www.synapse.org/ accession: syn10337516). The Ravi et al. cohort 1 (LUAD) and cohort 2 (LUSC) are NSCLC cohorts from the SU2C-MARK study35, available through the dbGaP under accession number phs002822.v1.p1. The Snyder et al. cohort44 is available on Zenodo (https://doi.org/10.5281/zenodo.546110 The Rose et al.41 dataset is available on the Gene Expression Omnibus (GEO) under accession ID GSE176307. The melanoma cohort datasets are available under the following accession numbers: Liu et al.36 (dbGAP accession: phs000452.v3.p1), Gide et al.40 (ENA accession: PRJEB23709), Riaz et al.6 (BioProject accession: PRJNA356761), Van Allen et al.38 (dbGAP accession: phs000452.v2.p1), Hugo et al.46 (GEO accession: GSE78220) and Freeman et al. (the MGH cohort, dbGAP accession: phs002683.v1.p1)37. Additional information, including patient metadata, GENCODE annotations, cancer codes and COMPASS concepts, is available on the COMPASS website (https://www.immuno-compass.com/download Source data are provided with this paper.
Code availability
The Python implementation of immunotherapy response prediction models as well as COMPASS is available on GitHub at https://github.com/mims-harvard/COMPASS An interactive COMPASS prediction server is at https://www.immuno-compass.com/predict The COMPASS-based gene, gene set and concept feature extraction tool is available at https://www.immuno-compass.com/extract The data pipeline for processing FASTQ or count mRNA TPM data is at https://github.com/mims-harvard/COMPASS-web/tree/main/mRNA The COMPASS tool to generate personalized response maps is available at http://www.immuno-compass.com/explore/IMvigor210
References
Gong, J., Chehrazi-Raffle, A., Reddi, S. & Salgia, R. Development of PD-1 and PD-L1 inhibitors as a form of cancer immunotherapy: a comprehensive review of registration trials and future considerations. J. Immunother. Cancer 6, 8 (2018).
Havel, J. J., Chowell, D. & Chan, T. A. The evolving landscape of biomarkers for checkpoint inhibitor immunotherapy. Nat. Rev. Cancer 19, 133–150 (2019).
Wang, M. M., Coupland, S. E., Aittokallio, T. & Figueiredo, C. R. Resistance to immune checkpoint therapies by tumour-induced T-cell desertification and exclusion: key mechanisms, prognostication and new therapeutic opportunities. Br. J. Cancer 129, 1212–1224 (2023).
Binnewies, M. et al. Understanding the tumor immune microenvironment (TIME) for effective therapy. Nat. Med. 24, 541–550 (2018).
Topalian, S. L., Taube, J. M., Anders, R. A. & Pardoll, D. M. Mechanism-driven biomarkers to guide immune checkpoint blockade in cancer therapy. Nat. Rev. Cancer 16, 275–287 (2016).
Riaz, N. et al. Tumor and microenvironment evolution during immunotherapy with nivolumab. Cell 171, 934–949 (2017).
Jiang, P. et al. Signatures of T cell dysfunction and exclusion predict cancer immunotherapy response. Nat. Med. 24, 1550–1558 (2018).
Auslander, N. et al. Robust prediction of response to immune checkpoint blockade therapy in metastatic melanoma. Nat. Med. 24, 1545–1549 (2018).
Ayers, M. et al. IFN-γ–related mRNA profile predicts clinical response to PD-1 blockade. J. Clin. Invest. 127, 2930–2940 (2017).
Wu, C.-C., Wang, Y. A., Livingston, J. A., Zhang, J. & Futreal, P. A. Prediction of biomarkers and therapeutic combinations for anti-PD-1 immunotherapy using the global gene network association. Nat. Commun. 13, 42 (2022).
Cristescu, R. et al. Pan-tumor genomic biomarkers for PD-1 checkpoint blockade–based immunotherapy. Science 362, eaar3593 (2018).
Hsiehchen, D. et al. Mutation burden and anti-PD-1 outcomes are not universally associated with immune cell infiltration or lymphoid activation. Cancer Cell 42, 1985–1987 (2024).
Dinstag, G. et al. Clinically oriented prediction of patient response to targeted and immunotherapies from the tumor transcriptome. Med 4, 15–30 (2023).
Hoang, D.-T. et al. A deep-learning framework to predict cancer treatment response from histopathology images through imputed transcriptomics. Nat. Cancer 5, 1305–1317 (2024).
Arnon, J. et al. Predictive value of ENLIGHT-DP in patients with metastatic lung adenocarcinoma treated with immune checkpoint inhibitors and platinum chemotherapy directly from histopathology slides using inferred transcriptomics. J. Immunother. Cancer 13, e010132 (2025).
Lapuente-Santana, Ó, van Genderen, M., Hilbers, P. A., Finotello, F. & Eduati, F. Interpretable systems biomarkers predict response to immune-checkpoint inhibitors. Patterns 2, 100293 (2021).
Jiang, Y. et al. IRnet: immunotherapy response prediction using pathway knowledge-informed graph neural network. J. Adv. Res. 72, 319–331 (2025).
Koh, P. W. et al. Concept bottleneck models. In Proc. of the 37th International Conference on Machine Learning 5338–5348 (PMLR, 2020); https://proceedings.mlr.press/v119/koh20a.html
Bergstrom, E. N. & Alexandrov, L. B. Enhanced precision in immunotherapy. Nat. Cancer 5, 1136–1138 (2024).
Chowell, D. et al. Improved prediction of immune checkpoint blockade efficacy across multiple cancer types. Nat. Biotechnol. 40, 499–506 (2022).
Rosenberg, J. E. et al. Atezolizumab in patients with locally advanced and metastatic urothelial carcinoma who have progressed following treatment with platinum-based chemotherapy: a single-arm, multicentre, phase 2 trial. Lancet 387, 1909–1920 (2016).
Balar, A. V. et al. Atezolizumab as first-line treatment in cisplatin-ineligible patients with locally advanced and metastatic urothelial carcinoma: a single-arm, multicentre, phase 2 trial. Lancet 389, 67–76 (2017).
Mariathasan, S. et al. TGFβ attenuates tumour response to PD-L1 blockade by contributing to exclusion of T cells. Nature 554, 544–548 (2018).
Roller, A. et al. Tumor-agnostic transcriptome-based classifier identifies spatial infiltration patterns of CD8+ T cells in the tumor microenvironment and predicts clinical outcome in early-phase and late-phase clinical trials. J. Immunother. Cancer 12, e008185 (2024).
Montauti, E., Oh, D. Y. & Fong, L. CD4+ T cells in antitumor immunity. Trends Cancer 10, 969−985 (2024).
Vanhersecke, L. et al. Mature tertiary lymphoid structures predict immune checkpoint inhibitor efficacy in solid tumors independently of PD-L1 expression. Nat. Cancer 2, 794–802 (2021).
Becker, T. et al. An enhanced prognostic score for overall survival of patients with cancer derived from a large real-world cohort. Ann. Oncol. 31, 1561–1568 (2020).
Chang, T.-G. et al. LORIS robustly predicts patient outcomes with immune checkpoint blockade therapy using common clinical, pathologic and genomic features. Nat. Cancer 5, 1158–1175 (2024).
Vanguri, R. S. et al. Multimodal integration of radiology, pathology and genomics for prediction of response to PD-(L) 1 blockade in patients with non-small cell lung cancer. Nat. Cancer 3, 1151–1164 (2022).
Yoo, S.-K. et al. Prediction of checkpoint inhibitor immunotherapy efficacy for cancer using routine blood tests and clinical data. Nat. Med. 31, 869–880 (2025).
Arango-Argoty, G. et al. Pretrained transformers applied to clinical studies improve predictions of treatment efficacy and associated biomarkers. Nat. Commun. 16, 2101 (2025).
Theodoris, C. V. et al. Transfer learning enables predictions in network biology. Nature 618, 616–624 (2023).
Li, M. M. et al. Contextual AI models for single-cell protein biology. Nat. Methods 21, 1546–1557 (2024).
McDermott, D. F. et al. Clinical activity and molecular correlates of response to atezolizumab alone or in combination with bevacizumab versus sunitinib in renal cell carcinoma. Nat. Med. 24, 749–757 (2018).
Ravi, A. et al. Genomic and transcriptomic analysis of checkpoint blockade response in advanced non-small cell lung cancer. Nat. Genet. 55, 807–819 (2023).
Liu, D. et al. Integrative molecular and clinical modeling of clinical outcomes to PD1 blockade in patients with metastatic melanoma. Nat. Med. 25, 1916–1927 (2019).
Freeman, S. S. et al. Combined tumor and immune signals from genomes or transcriptomes predict outcomes of checkpoint inhibition in melanoma. Cell Rep. Med. 3, 100500 (2022).
Van Allen, E. M. et al. Genomic correlates of response to CTLA-4 blockade in metastatic melanoma. Science 350, 207–211 (2015).
Kim, S. T. et al. Comprehensive molecular characterization of clinical responses to PD-1 inhibition in metastatic gastric cancer. Nat. Med. 24, 1449–1458 (2018).
Gide, T. N. et al. Distinct immune cell populations define response to anti-PD-1 monotherapy and anti-PD-1/anti-CTLA-4 combined therapy. Cancer Cell 35, 238–255 (2019).
Rose, T. L. et al. Fibroblast growth factor receptor 3 alterations and response to immune checkpoint inhibition in metastatic urothelial cancer: a real world experience. Br. J. Cancer 125, 1251–1260 (2021).
Choueiri, T. K. et al. Immunomodulatory activity of nivolumab in metastatic renal cell carcinoma. Clin. Cancer Res. 22, 5461–5471 (2016).
Miao, D. et al. Genomic correlates of response to immune checkpoint therapies in clear cell renal cell carcinoma. Science 359, 801–806 (2018).
Snyder, A. et al. Contribution of systemic and somatic factors to clinical response and resistance to PD-L1 blockade in urothelial cancer: an exploratory multi-omic analysis. PLoS Med. 14, e1002309 (2017).
Zhao, J. et al. Immune and genomic correlates of response to anti-PD-1 immunotherapy in glioblastoma. Nat. Med. 25, 462–469 (2019).
Hugo, W. et al. Genomic and transcriptomic features of response to anti-PD-1 therapy in metastatic melanoma. Cell 165, 35–44 (2016).
Kong, J. et al. Network-based machine learning approach to predict immunotherapy response in cancer patients. Nat. Commun. 13, 3703 (2022).
Davoli, T., Uno, H., Wooten, E. C. & Elledge, S. J. Tumor aneuploidy correlates with markers of immune evasion and with reduced response to immunotherapy. Science 355, eaaf8399 (2017).
Fehrenbacher, L. et al. Atezolizumab versus docetaxel for patients with previously treated non-small-cell lung cancer (POPLAR): a multicentre, open-label, phase 2 randomised controlled trial. Lancet 387, 1837–1846 (2016).
Huang, A. C. et al. A single dose of neoadjuvant PD-1 blockade predicts clinical outcomes in resectable melanoma. Nat. Med. 25, 454–461 (2019).
Joyce, J. A. & Fearon, D. T. T cell exclusion, immune privilege, and the tumor microenvironment. Science 348, 74–80 (2015).
Messina, J. L. et al. 12-chemokine gene signature identifies lymph node-like structures in melanoma: potential for patient selection for immunotherapy? Sci. Rep. 2, 765 (2012).
Nurmik, M., Ullmann, P., Rodriguez, F., Haan, S. & Letellier, E. In search of definitions: cancer-associated fibroblasts and their markers. Int. J. Cancer 146, 895–905 (2020).
Roh, W. et al. Integrated molecular analysis of tumor biopsies on sequential CTLA-4 and PD-1 blockade reveals markers of response and resistance. Sci. Transl. Med. 9, eaah3560 (2017).
Rooney, M. S., Shukla, S. A., Wu, C. J., Getz, G. & Hacohen, N. Molecular and genetic properties of tumors associated with local immune cytolytic activity. Cell 160, 48–61 (2015).
Gorishniy, Y., Rubachev, I., Khrulkov, V. & Babenko, A. Revisiting deep learning models for tabular data. In NIPSʼ21: Proceedings of the 35th International Conference on Neural Information Processing Systems (eds Ranzato, M. et al.) 18932–18943 (Curran Associates, 2021).
Choromanski, K. et al. Rethinking attention with performers. In International Conference on Learning Representations https://openreview.net/pdf?id=Ua6zuk0WRH (2021).
Snell, J., Swersky, K. & Zemel, R. Prototypical networks for few-shot learning. In NIPSʼ17: Proceedings of the 31st International Conference on Neural Information Processing Systems (eds von Luxburg, U. et al.) 4080−4090 (Curran Associates, 2017).
Lundberg, S. M. & Lee, S.-I. A unified approach to interpreting model predictions. In 31st Conference on Neural Information Processing Systems (eds Guyon, I. et al.) 4765–4774 (Curran Associates, 2017).
Liu, J. et al. An integrated TCGA pan-cancer clinical data resource to drive high-quality survival outcome analytics. Cell 173, 400–416 (2018).
Acknowledgements
We thank M. Cong for helpful discussions on immune checkpoint treatments. We thank S. Gao for advice and helpful suggestions on machine learning analyses.
Funding
We gratefully acknowledge the support of NSF CAREER Award 2339524, Harvard Data Science Initiative, Amazon Faculty Research, Google Research Scholar Program, AstraZeneca Research, Roche Alliance with Distinguished Scientists (ROADS) Program, Sanofi iDEA-iTECH Award, GlaxoSmithKline Award, Boehringer Ingelheim Award, Merck Award, Optum AI Research Collaboration Award, Pfizer Research, Gates Foundation (INV-079038), Chan Zuckerberg Initiative, John and Virginia Kaneb Fellowship at Harvard Medical School, Biswas Computational Biology Initiative in partnership with the Milken Institute, Collaborative Center for XDP at Massachusetts General Hospital, Harvard Medical School Dean’s Innovation Fund for the Use of Artificial Intelligence and the Kempner Institute for the Study of Natural and Artificial Intelligence at Harvard University. M.M.L. is supported by the Ivan and Francesca Berkowitz Family Living Laboratory Collaboration at Harvard Medical School and the Clalit Research Institute. T.H.N. acknowledges the support of NIH-2T32AI007512. W.S. acknowledges the support of the Information Technology Center, Zhejiang University and China Mobile Zhejiang Co., Ltd., Hangzhou Branch. Any opinions, findings, conclusions or recommendations expressed in this material are those of the authors and do not necessarily reflect the views of the funders. The funders had no role in study design, data collection and analysis, decision to publish or preparation of the manuscript.
Author information
Authors and Affiliations
Contributions
W.S., D.M. and M.Z. designed the study. W.S. and M.Z. conceptualized the COMPASS models and algorithm. D.M., W.S. and T.H.N. provided and processed gene signatures. W.S., T.H.N. and M.M.L. collected and preprocessed the datasets. W.S. implemented COMPASS and conducted benchmarking experiments. I.M. performed reproducibility and robustness evaluations of the COMPASS models. W.S. and T.H.N. performed patient survival analyses. Y.H. provided suggestions on the COMPASS model. W.S., T.H.N., N.N., D.M. and M.Z. contributed to biological interpretation of the results. All authors contributed to writing the manuscript.
Corresponding authors
Ethics declarations
Competing interests
D.M. and N.N. are currently employed by F. Hoffmann-La Roche Ltd. The other authors declare no competing interests.
Peer review
Peer review information
Nature Medicine thanks Federica Eduati, Peng Jiang, Hanwen Wang and the other, anonymous, reviewer(s) for their contribution to the peer review of this work. Primary Handling Editor: Liam Messin, in collaboration with the Nature Medicine team.
Additional information
Publisher’s note Springer Nature remains neutral with regard to jurisdictional claims in published maps and institutional affiliations.
Extended data
Extended Data Fig. 1 Analysis of COMPASS model concepts across cohorts and their association with treatment response.
(a) Overview of high-level TIME concepts organized into B cell, T/NK cell, myeloid, mesenchymal, and pathway/function categories. (b) UMAP embedding of COMPASS concept representations using TCGA and ICI patients, demonstrating cross-population consistency. (c) Heatmap of statistical significance of TIME concepts for distinguishing responders from non-responders across 16 cohorts using leave-one-cohort-out validation. Significant associations (p < 0.05) are marked with red asterisks; non-significant results with blue crosses. Statistical significance was assessed using a two-sided Mann-Whitney U test with no adjustment for multiple comparisons.
Extended Data Fig. 2 Comparison of COMPASS with conventional gene set scoring methods.
Comparison of COMPASS with conventional gene set scoring methods including geometric averaging and ssGSEA. (a) Conceptual comparison of scoring approaches. (b) Correlation between Cytotoxic T cell and Exhausted T cell scores across methods. (c) Pairwise correlations of Cytotoxic T cell scores. (d) Pairwise correlations of Exhausted T cell scores. Correlation coefficients (r) and p-values were calculated using two-sided Pearson correlation with no adjustment for multiple comparisons.
Extended Data Fig. 3 Benchmarking COMPASS patient representation learning strategies.
Benchmarking of COMPASS patient representation learning strategies under the LOCO evaluation setting. (a–c) Schematic of logistic regression pipelines using geometric mean, ssGSEA, and COMPASS-derived representations. (d) AUROC and (e) AUPRC across 16 ICI-treated cohorts for granular (132 dimensions) and high-level (43 dimensions) concept representations. Data are presented as mean ± SEM across 16 cohorts with individual data points overlaid. Statistical significance assessed using two-sided paired Wilcoxon signed-rank tests with no adjustment for multiple comparisons (* p < 0.05, ** p < 0.01, *** p < 0.001).
Extended Data Fig. 4 Radar COMPASS profiles for PD-L1 expression and TMB level in the IMvigor210 cohort.
Radar plots comparing COMPASS immune concept profiles across patient subgroups stratified by (a) PD-L1 immune cell score (IC2+ vs. IC0/1) and (b) tumor mutation burden (TMB-high ≥ 10 mut/Mb vs. TMB-low). The top 16 immune pathways and cell types are shown along radial axes, highlighting distinct immune characteristics between subgroups.
Extended Data Fig. 5 Heatmaps of COMPASS concept features and clinical annotations across four patient subgroups in the IMvigor210 cohort.
Integrative heatmap of COMPASS concept scores across four patient subgroups: inflamed responders, non-inflamed responders, inflamed non-responders, and strongly non-inflamed non-responders. (a) Heatmap of the top 16 COMPASS concept scores (Z-scores) with hierarchical clustering within each subgroup. (b) Patient-level annotations including COMPASS-predicted response probability, immune phenotype, and TMB level.
Extended Data Fig. 6 Zoomed-in views of personalized response maps for cytotoxic T cell activity.
Zoomed-in personalized response maps focusing on the Cytotoxic T cell concept for two IMvigor210 patients with contrasting phenotypes. (a) Immune-inflamed responder showing strong cytotoxic T cell activation. (b) Immune-desert non-responder demonstrating minimal cytotoxic T cell activity. The interactive visualization tool is available at www.immuno-compass.com.
Supplementary information
Supplementary Information (download PDF )
Figs. 1−37, Tables 1−12 and Methods 1−5.
Supplementary Data 1 (download XLSX )
Gene sets and their associated genes used to define each COMPASS concept, including granular and high-level TIME concepts.
Source data
Source Data Fig. 2 (download XLSX )
Raw model performance metrics (accuracy and AUPRC) across all cohorts and methods for leave-one-cohort-out and cohort-to-cohort transfer evaluations.
Source Data Fig. 3 (download XLSX )
Raw model performance metrics (accuracy and AUPRC) for cross-indication, cross-therapy and cross-target generalization evaluations.
Source Data Fig. 4 (download XLSX )
Raw model performance metrics (accuracy and AUPRC) for MSFT evaluations across drug-specific settings.
Source Data Fig. 5 (download XLSX )
Patient metadata, COMPASS scores and Kaplan−Meier survival analysis data for the IMvigor210 cohort.
Source Data Fig. 6 (download XLSX )
Patient-level COMPASS concept scores, gene scores and raw gene TPM values for personalized response map visualization.
Source Data Extended Data Fig. 1 (download XLSX )
TCGA and ICI patient concept embedding coordinates and pairwise statistical test P values.
Source Data Extended Data Fig. 2 (download XLSX )
Raw concept scores for Cytotoxic T Cell and Exhausted T Cell across scoring methods.
Source Data Extended Data Fig. 3 (download XLSX )
Raw model performance metrics (AUROC and AUPRC) for benchmarking COMPASS patient representation learning strategies.
Source Data Extended Data Fig. 4 (download XLSX )
Raw COMPASS concept scores for radar plot visualization across immune phenotype and TMB groups.
Source Data Extended Data Fig. 5 (download XLSX )
Raw COMPASS concept scores and patient-level data for personalized response map analysis.
Source Data Extended Data Fig. 6 (download XLSX )
Gene-level and concept-level scores and gene TPM expression values for individual patient network visualization.
Rights and permissions
Open Access This article is licensed under a Creative Commons Attribution-NonCommercial-NoDerivatives 4.0 International License, which permits any non-commercial use, sharing, distribution and reproduction in any medium or format, as long as you give appropriate credit to the original author(s) and the source, provide a link to the Creative Commons licence, and indicate if you modified the licensed material. You do not have permission under this licence to share adapted material derived from this article or parts of it. The images or other third party material in this article are included in the article’s Creative Commons licence, unless indicated otherwise in a credit line to the material. If material is not included in the article’s Creative Commons licence and your intended use is not permitted by statutory regulation or exceeds the permitted use, you will need to obtain permission directly from the copyright holder. To view a copy of this licence, visit http://creativecommons.org/licenses/by-nc-nd/4.0/
About this article
Cite this article
Shen, W., Moon, I., Nguyen, T.H. et al. Generalizable AI predicts immunotherapy outcomes across cancers and treatments. Nat Med (2026). https://doi.org/10.1038/s41591-026-04502-7
Received:
Accepted:
Published:
Version of record:
DOI: https://doi.org/10.1038/s41591-026-04502-7